UNITED STATES
SECURITIES AND EXCHANGE COMMISSION
Washington, D.C. 20549
Form 6-K
REPORT OF FOREIGN PRIVATE ISSUER PURSUANT TO
RULE
13a-16 OR 15d-16 UNDER
THE SECURITIES EXCHANGE ACT OF 1934
For the month of August 2025
Commission File Number: 001-34936
Noah Holdings Limited
(Registrant’s name)
No. 1226, South Shenbin Road, Minhang District,
Shanghai, People’s Republic of China
+86 (21) 8035-8292
(Address of principal executive office)
Indicate by check mark whether the registrant files or will file annual reports under cover Form 20-F or Form 40-F.
Form 20-F x Form 40-F ¨
EXHIBIT INDEX
SIGNATURE
Pursuant to the requirements of the Securities Exchange Act of 1934, the registrant has duly caused this report to be signed on its behalf by the undersigned, thereunto duly authorized.
| Noah Holdings Limited | ||
| By: | /s/ Qing Pan | |
| Name: | Qing Pan | |
| Title: | Chief Financial Officer | |
| Date: August 28, 2025 | ||
Exhibit 99.1
Hong Kong Exchanges and Clearing Limited and The Stock Exchange of Hong Kong Limited take no responsibility for the contents of this announcement, make no representation as to its accuracy or completeness and expressly disclaim any liability whatsoever for any loss howsoever arising from or in reliance upon the whole or any part of the contents of this announcement.
Noah Holdings
Noah Holdings Private Wealth and Asset Management Limited
諾亞控股私人財富資產管理有限公司
(Incorporated
in the Cayman Islands with limited liability under the name Noah Holdings Limited and
carrying on business in Hong Kong as Noah Holdings Private Wealth and Asset Management Limited)
(Stock Code: 6686)
DISCLOSEABLE
TRANSACTION IN RESPECT OF
SUBSCRIPTION IN A PRIVATE CREDIT DIGITAL YIELD FUND
THE SUBSCRIPTION
On August 27, 2025 (U.S. Eastern Time), Joy Triple Star, a wholly owned subsidiary of the Company, committed to subscribing for the Subscribed Interests in Olive Digital Fund with a total capital commitment of US$50.0 million (equivalent to approximately HK$389.2 million), subject to the terms and conditions of the Fund Documents in relation to the Subscription. Capital contributions in respect of the Subscribed Interests will be funded by the Group’s internal resources and are payable in cash.
By subscribing to the Subscribed Interests in Olive Digital Fund, the Group seeks to deploy treasury in a risk-defined private credit strategy, while within the limits permitted under the Fund Documents, obtaining controlled and ancillary exposure to the digital-asset ecosystem for diversification and capability-building purposes.
IMPLICATIONS UNDER THE HONG KONG LISTING RULES
The Subscription constitutes a discloseable transaction under Rule 14.06(2) of the Hong Kong Listing Rules as one or more of the applicable percentage ratios exceed 5% but all of them are less than 25%, and are therefore subject to the reporting and announcement requirements under Chapter 14 of the Hong Kong Listing Rules.
THE SUBSCRIPTION
On August 27, 2025 (U.S. Eastern Time), Joy Triple Star, a wholly owned subsidiary of the Company, as one of the Limited Partners, committed to subscribing for the Subscribed Interests in Olive Digital Fund with a total capital commitment of US$50.0 million (equivalent to approximately HK$389.2 million), subject to the terms and conditions of the Fund Documents in relation to the Subscription. Capital contributions in respect of the Subscribed Interests will be funded by the Group’s internal resources and are payable in cash.
1
Guided by its primary treasury objective of enhancing returns on the basis of capital preservation, the Group’s Subscription represents a strategic allocation to a “cash management plus” product. The investment employs a dual-allocation strategy, focusing primarily on generating stable income from a risk-defined credit portfolio, while obtaining controlled and ancillary exposure to the digital asset ecosystem for the purposes of long-term diversification and capability-building.
Principal Terms of Olive Digital Fund
The principal terms of Olive Digital Fund in relation to Subscribed Interests are as follows:
| Name of the Fund | : | Olive Partners Digital Yield Fund I, LP |
| General Partner | : | Olive Partners Cayman GP I, Ltd. |
| Investment Manager | : | Olive Partners Management LLC |
| Administrator | : | Maples Fund Services (Cayman) Limited |
| Custodians | : | City National Bank |
| Coinbase Custody Trust Company, LLC | ||
| Target size | : | The Fund has a target investment size of around US$80 million with the aim of achieving an internal rate of return (IRR) exceeding mid-single digit range. |
| Investment objective and strategy | : | The investment objective of the Fund is to achieve a blend of income generation and capital appreciation by deploying capital into a dual-allocation strategy that involves (i) lending U.S. dollar-pegged stablecoins to institutional counterparties and (ii) reinvesting a portion of the resulting yields into Bitcoin. Its strategy is intended to provide stable near-term returns while offering long-term exposure to potential upside in the digital assets. |
| The Fund offers multiple share classes with differentiated exposure to Bitcoin, including: (i) Class A Interests: anticipated to allocate monthly income derived from stablecoin lending into Bitcoin; and (ii) Class B Interests: structured similarly to Class A, with the additional feature of gradually deploying up to 20% of the original capital into Bitcoin over the course of the first year. The pace and extent of such deployment may vary depending on market conditions, fund liquidity, and manager discretion. |
2
| Term | : | The Fund has a four (4)-year term commencing on the date of the Limited Partnership Agreement, unless wound-up and dissolved earlier under the dissolution provisions provided in the Limited Partnership Agreement, including, among others, (i) the decision of the General Partner; (ii) the withdrawal, bankruptcy, insolvency or dissolution of the General Partner or the occurrence of any other event as stipulated in the governing laws and regulations; and (iii) an order of the Grand Court of the Cayman Islands for the winding-up and dissolution. |
| Redemption | : | Each Limited Partner may request withdrawals from its effective capital account in the Fund (the “Capital Account”) as of the end of each fiscal year, subject to a ninety (90)-day prior written notice period and the consent of the General Partner, which may be granted or withheld in its absolute and sole discretion. The General Partner may, in its sole discretion, cause the Fund to distribute cash or property to the General Partner and Limited Partners as part of withdrawal, at such times and in such amounts as it shall determine its sole discretion. |
| The General Partner is entitled to, among other things: (i) withhold up to 5% of the Capital Account for withdrawals of 90% or more of the Capital Account balance for the Fund’s liabilities and other contingencies until no later than thirty (30) days after the completion of its year-end audit; (ii) establish reserves and holdbacks for estimated accrued expenses, liabilities, and contingencies which could reduce the amount of a distribution upon withdrawal; and (iii) satisfy all or part of a withdrawal request by a distribution in kind of assets, including digital assets or securities in-kind. Furthermore, the General Partner may, by written notice, compel the withdrawal of all of a Limited Partner’s interest at any time and for any reason. Any withdrawal is also subject to the deduction of any accrued incentive allocation payable to the General Partner. | ||
| Transferability | : | The limited partnership interest, or any beneficial interest therein, may not be transferred, mortgaged, assigned or otherwise disposed of, in whole or in part, except with the written consent thereto of the General Partner given in its sole discretion. The transferring Limited Partner and the transferee shall have agreed in writing to provide the Fund with any information requested by the General Partner relating to the Fund’s obligation to make basis adjustments under applicable laws, rules and regulations. |
| Management | : | The General Partner is responsible for the overall management and operation of the Fund and has ultimate authority over its affairs. |
3
| The General Partner has engaged the Investment Manager to provide ongoing investment management and administrative services. Pursuant to this delegation, the Investment Manager is authorized to conduct the Fund’s day-to-day operations, manage investments, retain service providers, make tax and accounting elections, and perform other functions customarily performed by an investment manager. While the Investment Manager may delegate certain duties to affiliates or third parties, it remains responsible for the supervision of such delegates. | ||
| An advisory committee comprising the representatives of the Limited Partners (the “Advisory Committee”), may be constituted to act in a consultative capacity and will be consulted by the General Partner on certain matters as specified in the Limited Partnership Agreement, which include, among other things, potential conflicts of interest and approving the valuation policies of the Fund. The Advisory Committee will not have any authority to make investment decisions or otherwise participate in the Fund’s management or control of the business. | ||
| Management fee | : | For the initial year of operations, the annual management fee is 2.0% of the capital commitments made by the respective Limited Partners (the “Capital Commitments”), with half of the management fee (i.e., 1.0% of Capital Commitments) satisfied upfront at the time of its initial capital contribution. Commencing from the second year of operations, the annual management fee is 1.0% of Capital Contributions used to fund the cost of any unrealized investments then held by the Fund. |
| Distributions | : | In the discretion of the General Partner, following consultation with the Investment Manager, a Limited Partner may receive in-kind distributions from the Partnership’s portfolio. Such investments so distributed may not be readily marketable or saleable and may have to be held by such Limited Partner for an indefinite period of time. Any such in-kind distributions will not materially prejudice the interests of the remaining Limited Partners in the same class, to the extent applicable. If the Partnership distributes securities in-kind in satisfaction of a withdrawal request, the General Partner may, in its sole discretion, at the request of any Limited Partner and to the extent practicable, hold any such securities in trust or in a liquidating special purpose vehicle and liquidate such securities on the Limited Partner’s behalf in which case (i) payment to such Limited Partner of that portion of its withdrawal attributable to such securities will be delayed until such time as such securities can be liquidated and (ii) the amount otherwise due to such Limited Partner will be increased or decreased to reflect the performance of such securities through the date on which the liquidation of such securities is effected, and any applicable expenses, the management fee and accrued incentive allocation. |
4
| If a Limited Partner is obligated pursuant to applicable law, rules and regulations to return a distribution made to it where the Fund is insolvent, such distribution shall be returned without the application of interest. | ||
| Incentive allocation | : | Subject to different classes of interests the Limited Partners subscribe to, the General Partner may be entitled to receive an allocation equal to an incentive allocation percentage of the net income allocated to such Limited Partner. In relation to the Subscribed Interests, the General Partner is not entitled to receive any incentive allocation, while the net income or net loss of the Fund (including realized and unrealized gains and losses) will be allocated to Joy Triple Star in proportion to its Capital Account balance. |
| Payment | : | Each Limited Partner is expected to fund its entire capital commitment in cash within five days upon admission to the Partnership. |
INFORMATION ON THE UNDERLYING ASSET IN RELATION TO THE SUBSCRIBED INTERESTS
The Subscribed Interests provide the Group with an economic exposure derived from the Fund’s deployment of capital into a dual-allocation strategy. In the initial year of operations, this strategy primarily consists of a secured credit loan of USDC extended to Coinbase Custody International Limited, which is expected to be collateralized by Bitcoin with a target collateralization ratio over 100%. Actual collateral levels and recovery prospects will depend on prevailing market conditions and the terms of the lending arrangement. Commencing from the second year of operations, the Fund intends to reinvest yield proceeds annually into digital assets, including but not limited to Bitcoin, based on prevailing market terms and negotiated rates.
The Subscribed Interests are under Class A Interests of the Fund, which are designed to allocate the monthly income generated from stablecoin lending activities into Bitcoin. All lending, trading, and custody activities are intended to be conducted through Coinbase, Inc., a U.S.-based digital asset platform that is publicly listed and subject to regulatory oversight.
Notwithstanding the foregoing credit enhancements, the Subscription may be subject to certain risks in association with the Fund’s structure, including the risk of total loss of invested capital, as well as other risks such as digital asset volatility, stablecoin depegging, lending counterparty default, custodian failure, and adverse changes in regulatory treatment of digital assets.
REASONS FOR AND BENEFITS OF THE SUBSCRIPTION
The amount of Capital Commitment for the Subscription was determined by the Subscriber after considering (i) the terms of the Funds Documents as compared to that offered by other comparable investment products available in the market; (ii) the Fund’s investment strategy and underlying assets, in particular its dual-allocation portfolio consisting of secured lending of U.S. dollar-pegged stablecoins and reinvestment of yield proceeds into Bitcoin and other digital assets, and the potential of such strategy to generate income and long-term capital appreciation; (iii) the Group’s existing investment portfolio, with reference to its overall exposure, diversification, expected return profile, and risk tolerance; and (iv) the Group’s cash management requirements, including an assessment of the Fund’s liquidity terms.
5
In line with its investment objectives, the Company conducts regular reviews of its investment portfolios and makes timely adjustments to optimize capital preservation, with the aim of delivering consistent, risk-adjusted returns to its Shareholders. The Directors believe that the Subscription is in line with the Group’s long-term investment strategy, is on normal commercial terms, and is in the interests of the Company and its Shareholders as a whole. In reaching this view, the Directors have considered the following factors:
| (i) | Strategic allocation and portfolio diversification |
The Subscription is guided by the Group’s core treasury management principle: enhancing investment returns on the fundamental premise of capital preservation, representing a strategic and forward-looking allocation for the Group and providing the Group with disciplined exposure to the emerging digital assets. This initiative is intended to diversify the Group’s existing investment portfolio, which is consistent with the Group’s objective of achieving consistent, long-term risk-adjusted returns through prudent capital allocation into sectors with growth potential.
As set out in the section “Principal Terms of Olive Digital Fund” above, the Fund’s dual-allocation strategy is designed to generate both income and capital appreciation. The Fund has a target internal rate of return (IRR) exceeding mid-single digit range, driven principally by the agreed-upon lending interest rate and potential appreciation of its Bitcoin holdings. This structure directly supports the Group’s overarching investment strategy, which is fundamentally guided by capital preservation and prudent risk management. The Subscription is structured such that the Group’s principal capital is allocated to the Fund’s lower-risk, yield-generating activities. Consequently, the Group’s exposure to more volatile assets, such as Bitcoin, is funded solely from the interest income generated by the Fund, thereby creating upside potential while strictly defining and limiting the Group’s direct capital risk.
| (ii) | Access to a high-growth digital assets ecosystem |
The Subscription enables the Group to gain strategic exposure to the fast-evolving digital asset ecosystem through a professionally managed and regulated investment vehicle. By participating via the Fund, the Company is able to capture opportunities in one of the highest-growth sectors of global finance without assuming the full operational, custody, and compliance burdens associated with direct investment.
This approach allows the Group to benefit from the potential upside of digital assets in a structured and diversified manner, as the Fund’s dual-allocation strategy combines stablecoin lending with reinvestment of yield proceeds into Bitcoin and other digital assets. Such an allocation provides a balance between near-term income generation and long-term capital appreciation, while reducing concentration risk that would otherwise arise from direct, single-asset purchases.
| (iii) | Expertise of a specialized management team |
While the Investment Manager is a newly established entity and a member of the Group, it is operated under the Company’s own brand, Olive Asset Management, the Company’s business that manages USD-denominated private equity funds and private secondary products. Over the past two and a half years, the Company has significantly enhanced the competitiveness of its overseas primary market product shelf, which allows the Company to offer private equity products that are on par with those provided by leading global private banks.
6
The Board’s decision is predicated on the capability and deep domain expertise of the Company’s very own investment management team. The management team of the Investment Manager is comprised of seasoned professionals who possess a demonstrable track record and a unique combination of expertise in blockchain technology and private equity investment experience. For the details of the biography of the management team of the Investment Manager, please refer to “Information on the Parties — (iv) Investment Manager — Olive Partners Management” below.
| (iv) | Risk-managed framework and enhanced oversight |
Olive Digital Fund provides the Group with a structured and institutional-grade vehicle designed to mitigate risks inherent in the digital asset market. Unlike direct investment in crypto exchanges or speculative trading, the Fund adopts a disciplined risk management framework that combines secured lending, portfolio diversification, and ongoing monitoring of counterparties and collateral. This structure reduces exposure to concentrated risks such as extreme asset price volatility, counterparty default, or operational failures in custody and trading.
A key benefit of this approach is the alignment of governance and oversight. Through its relationship with the Investment Manager, the Group is able to exert a greater degree of influence over operational policies, investment protocols, and risk controls than would typically be possible with an unaffiliated third-party manager. This enhanced oversight ensures that investment activities remain consistent with the Group’s overall risk appetite, compliance standards, and fiduciary responsibilities to its Shareholders.
Furthermore, the Fund’s framework incorporates collateralized lending arrangements and structured reinvestment mechanics, which provide an additional layer of protection compared to unstructured exposure to digital assets. These features allow the Group to capture the growth potential of the sector while managing downside risks in a more transparent and measurable way.
Taken together, these elements enable the Subscription to serve as a risk-adjusted gateway to digital asset exposure: it offers the Group potential returns while safeguarding capital through formalized governance, structured protocols, and enhanced monitoring, thereby ensuring that the Company’s and Shareholders’ interests are prioritized and protected.
| (v) | Alternative investment opportunities |
In assessing the Subscription, the Board also considered alternative investment opportunities for gaining exposure to this sector, such as the direct purchase of digital assets on crypto and digital asset exchanges. These alternatives were ultimately not pursued as they were deemed inconsistent with the Group’s risk management framework, which prioritizes a structured, risk-mitigated approach over direct speculative investment. The Subscription was therefore identified as the most suitable vehicle to achieve the Group’s strategic objectives in this area.
Having considered the reasons set out above, the Directors (including the independent Directors) are of the view that the terms of the Subscription are fair and reasonable and in the interests of the Company and its Shareholders as a whole.
7
INFORMATION ON THE PARTIES
| (i) | The Company and Joy Triple Star |
The Company is a leading and pioneer wealth management service provider offering comprehensive one-stop advisory services on global investment and asset allocation primarily for Mandarin-speaking high-net-worth investors.
Joy Triple Star, the Subscriber, is a wholly owned subsidiary of the Company established under the law of the British Virgin Islands with limited liability on January 12, 2008 and acts as an investment holding platform within the Group.
| (ii) | Olive Digital Fund |
Olive Digital Fund is an exempted limited partnership established and registered in accordance with Section 9 of the Exempted Limited Partnership Act (As Revised) of the Cayman Islands on June 25, 2025.
Based on information provided by the Investment Manager:
| a. | As of the date of this announcement, the Subscriber has not yet made any capital contributions to the Fund. However, assuming the Fund achieves its target size and the full amount of the capital commitments by the Subscriber and all other Limited Partners is contributed to the Fund, the Subscriber would hold approximately 62.5% of the aggregate partnership interests in the Fund. |
| b. | Given the Fund’s structure and its objective to raise additional capital through one or more subsequent closings, the Fund’s size is expected to increase over the fundraising period, which will continue for 12 months from the date of the Limited Partnership Agreement, with the General Partner having the discretion to extend such period for one additional month. Accordingly, the Fund is expected to have a broader investor base over its term. Consequently, and as contemplated by the Fund’s constitutional documents, the Subscriber’s percentage interest in the Fund is expected to be diluted as the Fund admits new investors in subsequent closings of the further subscriptions. |
| (iii) | General Partner — Olive Partners Cayman |
The General Partner is Olive Partners Cayman, an exempted company with limited liability incorporated in the Cayman Islands, and each shareholder of which is an employee of the Group who is an Independent Third Party. As of the date of this announcement, the directors of Olive Partners Cayman were Mr. Byron Ye (“Mr. Ye”) and Mr. Wei Zhou (“Mr. Zhou”), who concurrently served as the directors of the Investment Manager, making it an affiliate of Olive Partners Cayman.
8
| (iv) | Investment Manager — Olive Partners Management |
The Investment Manager is Olive Partners Management, a limited liability company incorporated in Delaware on July 8, 2024, and a member of the Group controlled by the Company through a series of contractual arrangements. Each registered member of Olive Partners Management is an employee of the Group.
The Affiliation with the Group through Contractual Arrangements
Since its establishment in July 2024, the Investment Manager has generated investment advisory and management fees, which have not constituted a material source of revenue for the Group during this initial period. Its assets as of December 31, 2024 and June 30, 2025 were not material to the Group, being less than 0.1% of the total assets of the Group.
Through contractual arrangements, the Company exercises effective control over Olive Partners Management for the operation of the Group’s U.S.-based asset investment management business.
Reasons for Adopting the Contractual Arrangements
In the United States, certain transactions involving foreign investment are subject to review by the Committee on Foreign Investment in the United States (CFIUS), an inter-agency body authorized to assess the national security effects of such investments. CFIUS has broad jurisdiction to review investments by foreign persons in U.S. businesses, particularly in sensitive sectors involving technology, critical infrastructure, and personal data. Depending on the nature of the transactions and the sectors involved, CFIUS may require mandatory filings or encourage voluntary notices for CFIUS review of the transactions. In the current geopolitical environment, investments made by China-based investors are subject to heightened scrutiny and additional regulatory oversight, which can lead to increased compliance requirements, potential transaction delays, and the risk of prohibition or forced divestment.
In practice, certain asset investment opportunities (including in the digital assets space) or fund structures in the U.S. market may have specific requirements regarding the nationality, residency, or corporate structure of investment managers. This complex and evolving landscape presents unique operational challenges and considerations for China-based asset management companies seeking to invest in the United States.
The Company adopted the contractual arrangements to enhance its ability to effectively access and manage investment opportunities in the U.S. asset management market and mitigate potential operational hurdles encountered by foreign-owned investment managers under Olive Partners Management, while remaining mindful of the complex regulatory landscape applicable to foreign investors. By utilizing this arrangement, the Company aims to better position itself to participate in the dynamic U.S. market, including in emerging and specialized sectors such as digital assets.
9
Structure of the Contractual Arrangements
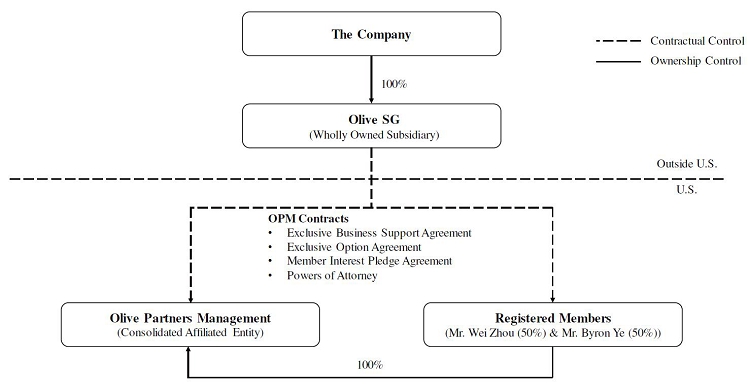
The Company, through Olive SG, its wholly owned subsidiary, entered into a series of contractual arrangement with Olive Partners Management and/or its registered members, being Mr. Ye and Mr. Zhou, on July 8, 2024. The agreements underlying the contractual arrangements with Olive Partners Management and/or its registered members include an exclusive business support agreement, an exclusive option agreement, a membership interest pledge agreement and powers of attorney (together, the “OPM Contracts”).
The OPM Contracts enable the Group to (a) exercise effective control over Olive Partners Management, primarily through the irrevocable powers of attorney granted by its registered members, which empower the Group to exercise all member rights; (b) receive the economic benefits generated by Olive Partners Management, pursuant to the exclusive business support agreement under which Olive SG provides services in exchange for service fees; (c) have an exclusive and irrevocable option to acquire (by itself or through a designated third party) all or part of the membership interests in Olive Partners Management; and (d) receive a pledge of the membership interests in Olive Partners Management as collateral to secure the registered members’ and Olive Partners Management’s performance of their obligations under the OPM Contracts. The OPM Contracts allow the Group to consolidate the financial results of Olive Partners Management as a variable interest entity.
The diagram below illustrates the summary of structure under the OPM Contracts:
Based on its review of the OPM Contracts, the Company’s U.S. legal advisor has confirmed that each of these contracts is, and taken as a whole are, valid and legally binding on the parties thereto.
10
Reputation and Experience
The Investment Manager’s team comprises talented, competent and capable professionals with specialized expertise in investment and assets management.
| a. | Experienced Team |
The management of Olive Partners Management is led by its managing director, Mr. Ye, an employee of the Group. He is an accomplished investment professional with over 25 years of experience and a strong track record in private equity and venture capital, with a focus on identifying high-potential companies, guiding them through critical growth phases, and generating long-term value for investors.
Mr. Ye is supported by Mr. Zhou, also a director at Olive Partners Management and an employee of the Group. Mr. Zhou focuses on identifying investment opportunities within U.S. private markets, including venture capital and private equity fund investments, technology direct/co-investments, secondaries, and special opportunities.
While Olive Partners Management itself was recently established in July 2024, the collective experience and professional capabilities of its management team provide the necessary foundation for executing sophisticated digital asset investment strategies. The management team members’ diverse backgrounds in traditional investment management, technology sector investments, and alternative asset classes position them well to navigate the complexities of the digital asset ecosystem and capitalize on emerging opportunities in this rapidly evolving market.
| b. | Strategic Network and Market Access |
The management team of Olive Partners Management leverages extensive networks and relationships within both traditional investment management and the digital asset ecosystem. Their professional backgrounds provide access to a broad spectrum of investment opportunities, including direct investments in blockchain technology companies, digital asset funds, and other digital asset-related ventures. This network enables Olive Partners Management to identify and evaluate investment opportunities that may not be readily accessible to other market participants, thereby enhancing the potential for attractive risk-adjusted returns for the Fund.
| (v) | Administrator – Maples Fund Services (Cayman) Limited |
Maples Fund Services (Cayman) Limited is a Cayman Islands company regulated by the Cayman Islands Monetary Authority and is engaged to provide fund administration services, including net asset value calculation, investor services, and maintenance of the books and records of Olive Digital Fund.
11
| (vi) | Custodians |
City National Bank
City National Bank is a national banking association regulated by the Office of the Comptroller of the Currency in the United States and serves as a fiat currency custodian for the U.S. dollar holdings of Olive Digital Fund.
Coinbase Custody Trust Company, LLC
Coinbase Custody Trust Company, LLC is a New York limited purpose trust company regulated by the New York State Department of Financial Services and is engaged to provide digital asset custody solutions for the cryptocurrency and stablecoin positions of Olive Digital Fund, including USDC and Bitcoin.
To the best of the Directors’ knowledge, information and belief having made all reasonable enquiries, save as disclosed above, all the other Limited Partners, the General Partner, the Investment Manager, the administrator, the custodians and their respective ultimate beneficial owners are Independent Third Parties.
IMPLICATIONS UNDER THE HONG KONG LISTING RULES
The Subscription constitutes a discloseable transaction under Rule 14.06(2) of the Hong Kong Listing Rules as one or more of the applicable percentage ratios are more than 5% but are less than 25% and are therefore subject to the reporting and announcement requirements under Chapter 14 of the Hong Kong Listing Rules.
DEFINITION
In this announcement, unless the context otherwise requires, the following expressions should have the following meanings:
| “ADS(s)” | American Depositary Shares (one ADS representing five Shares) | |
| “Articles” or “Articles of Association” | the memorandum of association and articles of association of the Company, as amended or supplemented from time to time | |
| “Bitcoin” | a type of cryptocurrency that operates using blockchain technology | |
| “Board” | the board of Directors | |
| “China” or “PRC” | the People’s Republic of China, excluding, for the purposes of this announcement only, Taiwan and the special administrative regions of Hong Kong and Macau, except where the context otherwise requires |
12
| “Company” | Noah Holdings Limited, an exempted company with limited liability incorporated in the Cayman Islands on June 29, 2007, carrying on business in Hong Kong as “Noah Holdings Private Wealth and Asset Management Limited (諾亞控股私人財富資產管理有限公司)” | |
| “Consolidated Affiliated Entity” | the entity that are controlled by the Company through contractual arrangements | |
| “Director(s)” | the director(s) of the Company | |
| “Fund Documents” | means, collectively, the Confidential Private Placement Memorandum, the Limited Partnership Agreement, the Subscription Agreement, and any related ancillary documents regarding the Subscription, in each case as amended and supplemented from time to time | |
| “General Partner” or “Olive Partners Cayman” | Olive Partners Cayman GP I, Ltd., an exempted company under the law of the Cayman Islands with limited liability on June 25, 2025 | |
| “Group”, “our Group”, “the Group”, “Noah”,“our ”, “us” or “we” | the Company, its subsidiaries and the Consolidated Affiliated Entities from time to time | |
| “HK$” | Hong Kong dollars, the lawful currency of Hong Kong | |
| “Hong Kong” | the Hong Kong Special Administrative Region of the PRC | |
| “Hong Kong Listing Rules” | the Rules Governing the Listing of Securities on The Stock Exchange of Hong Kong Limited | |
| “Hong Kong Stock Exchange” | The Stock Exchange of Hong Kong Limited or “HKEX” | |
| “Independent Third Party(ies)” | person(s) who are independent of the Group and independent of connected persons of the Company | |
| “Investment Manager” or “Olive Partners Management” | Olive Partners Management LLC, a Delaware limited liability company established on July 8, 2024 | |
| “Joy Triple Star” | Joy Triple Star Holdings Limited, a company established under the law of the British Virgin Islands with limited liability on January 12, 2008 and a wholly owned subsidiary of the Company | |
| “Limited Partner(s)” | the limited partners(s) of Olive Digital Fund |
13
| “Limited Partnership Agreement” | the amended and restated exempted limited partnership agreement of Olive Digital Fund | |
| “Olive Digital Fund”, “Fund” or “Partnership” | Olive Partners Digital Yield Fund I, LP, an exempted limited partnership established and registered in accordance with Section 9 of the Exempted Limited Partnership Act (As Revised) of the Cayman Islands on June 25, 2025 |
| “Olive SG” | Olive Capital Investments SG Pte. Ltd., an exempt private company limited by shares incorporated in Singapore on May 16, 2024 and a wholly owned subsidiary of the Company | |
| “RMB” or “Renminbi” | Renminbi yuan, the lawful currency of China | |
| “SEC” | the United States Securities and Exchange Commission | |
| “SFO” | the Securities and Futures Ordinance (Chapter 571 of the Laws of Hong Kong), as amended or supplemented from time to time | |
| “Share(s)” | ordinary share(s) in the share capital of the Company, and upon the revised Articles of Association becoming effective, any share(s) in the capital of the Company | |
| “Shareholder(s)” | the holder(s) of the Share(s), and where the context requires, ADSs | |
| “subsidiary” or “subsidiaries” | has the meaning ascribed thereto in section 15 of the Companies Ordinance (Chapter 622 of the Laws of Hong Kong), as amended or supplemented from time to time | |
| “Subscribed Interests” | Class A Interests of the Fund in connection with a total capital commitment of US$50.0 million (equivalent to approximately HK$389.2 million) subscribed by the Subscriber | |
| “Subscriber” | Joy Triple Star | |
| “Subscription” | the subscription by the Subscriber of Subscribed Interests in accordance with the terms of the Fund Documents |
14
| “USDC” | USD Coin, a digital stablecoin issued by Circle Internet Financial, LLC that is designed to maintain a 1:1 value with the U.S. dollar | |
| “U.S.” or “United States” | the United States of America, its territories, its possessions and all areas subject to its jurisdiction | |
| “U.S. dollar(s)” or “US$” | United States dollar(s), the lawful currency of the United States | |
| “%” | per cent |
For the purpose of this announcement and for illustrative purpose only, conversions of US$ to HK$ are based on the exchange rate of US$1.00 = HK$7.7849. No representation is made that any amounts in HK$ or US$ can be or could have been converted at the relevant dates at the above rate or at any other rates or at all.
| By order of the Board | |
| Noah Holdings Private Wealth and Asset Management Limited | |
| Jingbo Wang | |
| Chairwoman of the Board |
Hong Kong, August 28, 2025
As of the date of this announcement, the Board comprises Ms. Jingbo Wang, the chairwoman, and Mr. Zhe Yin as Directors; Ms. Chia-Yue Chang, Mr. Boquan He and Mr. David Zhang as non-executive Directors; and Ms. Xiangrong Li, Ms. Cynthia Jinhong Meng and Ms. May Yihong Wu as independent Directors.
15
Exhibit 99.2
Hong Kong Exchanges and Clearing Limited and The Stock Exchange of Hong Kong Limited take no responsibility for the contents of this announcement, make no representation as to its accuracy or completeness and expressly disclaim any liability whatsoever for any loss howsoever arising from or in reliance upon the whole or any part of the contents of this announcement.
Noah Holdings
Noah Holdings Private Wealth and Asset Management Limited
諾亞控股私人財富資產管理有限公司
(Incorporated in the Cayman Islands with limited liability under the name Noah Holdings Limited and
carrying on business in Hong Kong as Noah Holdings Private Wealth and Asset Management Limited)
(Stock Code: 6686)
INSIDE INFORMATION
INTERIM RESULTS ANNOUNCEMENT
FOR THE SIX MONTHS ENDED JUNE 30, 2025
This announcement is issued pursuant to Rule 13.09 of the Hong Kong Listing Rules and the Inside Information Provision under Part XIVA of the SFO.
The Board is pleased to announce the unaudited consolidated interim results of the Company for the six months ended June 30, 2025, together with the comparative figures for the corresponding period in 2024. These interim results have been prepared under the U.S. GAAP, which are different from the IFRS, and reviewed by the Audit Committee.
In this announcement, “Noah,” “we,” “us” and “our” refer to the Company and where the context otherwise requires, the Group. Certain amounts and percentage figures included in this announcement have been subject to rounding adjustments, or have been rounded to one or two decimal places. Any discrepancies in any table, chart or elsewhere between totals and sums of amounts listed therein are due to rounding.
BUSINESS HIGHLIGHTS
The global macroeconomic environment in the first half of 2025 was volatile, marked by trade fragmentation and diverging monetary policies that added to existing growth constraints. Against this backdrop, liquidity conditions remained relatively tight as global central banks maintained policy rates at multi-year highs to rein in inflation. Geopolitical headwinds – ranging from renewed trade tensions to technology-export controls – sustained bouts of market volatility and reinforced investors’ preference for safe-haven assets. China’s economy remained under pressure, with subdued consumer demand and ongoing weakness in the real estate sector weighing on overall growth. Within China’s wealth management industry, HNW individuals continued to prioritize wealth preservation and liquidity. As a result, demand is gradually shifting toward providers of high-quality global strategies where transparency, diversification and downside protection are more readily obtained.
1
Our firm’s disciplined, forward-looking strategy continues to provide us with flexibility to navigate this challenging environment and ensure the resilience of our business. As highlighted in our semi-annual CIO1 report for the second half of 2025, we are also witnessing a major paradigm shift occurring. If the past two decades were defined by strategies to hedge against inflation and allocate into inflation-protected assets, the next twenty years will pivot to a new imperative: understanding, embracing, and profiting from technology-driven deflation. We are guiding clients to embrace this evolving landscape where growth is no longer fueled by debt-driven asset bubbles but by deflationary forces and efficiency dividends enabled by technological innovation. In response, our adaptive allocation framework is designed to balance current defensive positioning with future-facing offensive opportunities through three strategic pillars: inflation-hedged anchors, deflation-hedged assets, and flexible bridge holdings.
Our commitment to overseas expansion continues delivering promising results. By combining our personalized service model with an expanding portfolio of global products, we have established a significant competitive advantage. In the first half of 2025, we made notable progress: we established our ARK global headquarters in Singapore, entered into a strategic partnership with Tokyo Star Bank in Japan through our ARK Japan subsidiary, and officially joined the Family Office Association of Hong Kong. These developments position us at the crossroads of Asia’s evolving capital flows, enabling us to turn regional headwinds into long-term strategic advantages. As ever, we continue seeing tremendous growth potential in serving global Chinese HNW investors overseas who share our cultural values and place their trust in our long-standing track record. As a key booking center, Singapore has demonstrated robust momentum, with deposit volumes rising steadily and transaction value through Singapore-based channels increasing substantially, signaling clear potential for further expansion among local clients.
By consistently focusing on client and employee education, we believe we are strongly positioned to guide stakeholders through the coming market shifts. Our global growth journey has only just begun, and we remain confident in our ability to navigate challenges and capitalize on the opportunities that lie ahead.
FINANCIAL HIGHLIGHTS
During the Reporting Period, we successfully navigated through a complex macroeconomic environment both domestically and internationally, while simultaneously advancing our internal structure transformation. As a result of these efforts and strategic focus, our net revenue for the six months ended June 30, 2025 was RMB1,244.1 million, representing a slight decrease of 1.7% as compared to the corresponding period in 2024, mainly due to a decline in distribution of insurance products. Our net income attributable to the Shareholders increased by 41.6% from RMB231.3 million for the six months ended June 30, 2024 to RMB327.5 million for the six months ended June 30, 2025. Similarly, our Non-GAAP net income attributable to the Shareholders increased by 33.9% from RMB267.2 million during the same period last year to RMB357.8 million for the Reporting Period, mainly due to an increase in the fair value of the funds managed by Gopher and a decrease in one-off expenses Gopher paid to one of its funds as general partner.
| 1. | “CIO” refers to the chief investment officer of the Company. |
2
Despite the challenges, we remain committed to investing in the overseas market by expanding our international relationship managers team and actively increasing our influence and wallet share among our Chinese clients globally. The transaction value of overseas products we distributed increased by 0.6% from RMB16.3 billion for the six months ended June 30, 2024 to RMB16.4 billion for the Reporting Period. Notably, we raised US$420 million for overseas hedge funds and structured products, marking a significant 282.0% year-over-year increase. Additionally, our AUM for overseas products grew by 5.9% from RMB39.1 billion as of June 30, 2024 to RMB41.4 billion as of June 30, 2025, and our overseas AUA grew by 6.6% from RMB8.5 billion as of June 30, 2024 to RMB9.1 billion as of June 30, 2025.
Non-GAAP Financial Measures
| For
the Six Months Ended June 30, |
||||||||||||
| 2024 (Unaudited) |
2025 (Unaudited) |
Change (%) |
||||||||||
| (RMB in thousands, except percentages) | ||||||||||||
| Total revenues | 1,274,843 | 1,254,722 | (1.6 | )% | ||||||||
| Net revenues | 1,265,389 | 1,244,095 | (1.7 | )% | ||||||||
| Income from operations | 255,501 | 347,034 | 35.8 | % | ||||||||
| Income before taxes and income from | ||||||||||||
| equity in affiliates | 372,441 | 416,982 | 12.0 | % | ||||||||
| Net income | 235,556 | 328,356 | 39.4 | % | ||||||||
| Net income attributable to the shareholders of the Company | 231,278 | 327,540 | 41.6 | % | ||||||||
| Non-GAAP Financial Measures: | ||||||||||||
| Net income attributable to the shareholders of the Company | 231,278 | 327,540 | 41.6 | % | ||||||||
| Add: share-based compensation expense | 58,479 | 37,788 | (35.4 | )% | ||||||||
| Add: settlement expense (reversal) | (11,476 | ) | – | N.A | ||||||||
| Less: tax effect of adjustments | 11,061 | 7,558 | (31.7 | )% | ||||||||
| Adjusted net income attributable to the shareholders of the Company (non-GAAP) | 267,220 | 357,770 | 33.9 | % | ||||||||
Adjusted net income attributable to the Shareholders is a non-GAAP financial measure that excludes the income statement effects of all forms of share-based compensation expenses, non-cash settlement expenses (reversal) and net of relevant tax impact. A reconciliation of adjusted net income attributable to the Shareholders from net income attributable to the Shareholders, the most directly comparable GAAP measure, can be obtained by subtracting expenses for share-based compensations and non-cash settlement. All tax expense impact of such adjustments would also be considered. The Company believes that the non-GAAP financial measures help identify underlying trends in its business and enhance the overall understanding of the Company’s past performance and future prospects.
3
The non-GAAP financial measures disclosed by the Company should not be considered a substitute for financial measures prepared in accordance with U.S. GAAP. The financial results reported in accordance with U.S. GAAP and reconciliation of U.S. GAAP to non-GAAP results should be carefully evaluated. The non-GAAP financial measures used by the Company may be prepared differently from and, therefore, may not be comparable to similarly titled measures used by other companies.
When evaluating the Company’s operating performance in the Reporting Period, management reviewed non-GAAP net income results reflecting adjustments to exclude the impact of share-based compensation, non-cash settlement expenses (reversal) and net of relevant tax impact. As such, the Company’s management believes that the presentation of the non-GAAP adjusted net income attributable to the Shareholders provides important supplemental information to investors regarding financial and business trends relating to its results of operations in a manner consistent with that used by management. Pursuant to U.S. GAAP, the Company recognized significant amounts of expenses for all forms of share-based compensation and non-cash settlement expenses (reversal) (net of tax impact). To make its financial results comparable period by period, the Company utilizes non-GAAP adjusted net income to better understand its historical business operations. The Company encourages investors and others to review its financial information in its entirety and not rely on a single financial measure.
BUSINESS REVIEW AND OUTLOOK
Business Review for the Reporting Period
While the first half of 2025 continued to bring challenges, it presented an opportunity for our Company to demonstrate our resilience through cost management and acceleration in our global expansion.
Wealth Management Business
During the Reporting Period, we generated total revenue of RMB862.7 million from our wealth management business, representing a 2.2% decrease from RMB881.8 million in the first half of 2024, mainly due to (i) a 3.5% decrease in total revenue generated from one-time commissions from RMB324.1 million for the six months ended June 30, 2024 to RMB312.8 million for the six months ended June 30, 2025, primarily due to reduced distribution of insurance products; (ii) a 3.3% decrease in total revenue generated from recurring service fees from RMB481.5 million for the six months ended June 30, 2024 to RMB465.7 million for the six months ended June 30, 2025, primarily due to a decrease in AUM associated with a decrease in existing private equity products in mainland China; and (iii) a 13.4% decrease in total revenue generated from other service fees from RMB65.1 million for the six months ended June 30, 2024 to RMB56.4 million for the six months ended June 30, 2025, primarily due to a reduction in value-added services provided to our clients. In the first half of 2025, we achieved an aggregate transaction value of RMB33.1 billion for the different types of investment products that we distributed, remaining stable compared to the six months ended June 30, 2024.
4
Asset Management Business
During the Reporting Period, we generated total revenue of RMB362.8 million from our asset management business, representing a 2.8% decrease compared to the six months ended June 30, 2024, mainly due to (i) a 1.4% decrease in recurring service fees in the six months ended June 30, 2025 which was effectively flat; and (ii) a 23.7% decrease in performance-based income in the six months ended June 30, 2025 compared to the same period in 2024, resulting from a decrease in income generated from domestic private equity products. Despite these challenges, through Gopher Asset Management, one of our Consolidated Affiliated Entities, and Olive Asset Management, a wholly-owned subsidiary of the Company, our AUM slightly decreased by 5.8% from RMB154.0 billion as of June 30, 2024 to RMB145.1 billion as of June 30, 2025, among which our overseas AUM reached RMB41.4 billion, representing an increase of 5.9% compared to RMB39.1 billion as of June 30, 2024, primarily driven by new fundraising of our actively managed USD products.
As of June 30, 2025, we maintained a sound capital structure with total assets of RMB11.7 billion and no interest-bearing liabilities. Throughout the Reporting Period, we remained committed to full compliance with all relevant laws and regulations that had a material impact on our business, such as the SFO, the Insurance Ordinance (Chapter 41 of the Laws of Hong Kong), and the Trustee Ordinance (Chapter 29 of the Laws of Hong Kong), among others.
Domestic Business Performance and Strategy
Domestically, our business continued to be impacted by a complex macroeconomic environment in China, with varied sectoral performance and continued structural adjustments. Our revenue contracted modestly during the Reporting Period as compared to the same period in 2024, despite a significant decrease from distribution of insurance products due to intensified market competition we faced as we continue to invest in building our commission-only broker team; the impact was partially offset by an increase of 9.6% in contribution from public securities products. While contributions from private equity products declined by 12.7%, they performed better than expected, supported by the fact that some of the funds gradually extended their terms.
Operating within China’s evolving economic landscape, we maintained disciplined execution of our domestic strategy despite persistent headwinds. Ongoing challenges in the property sector and cautious consumer sentiment created a complex environment for wealth management services. However, we view this period of consolidation as an opportunity to consolidate and reinforce our operational foundation for future growth. Our domestic operations benefited from the cost optimization initiatives implemented in late 2024, resulting in an 11.2% year-over-year reduction in operating expenses. Going forward, we remain focused on cost control, innovative client acquisition strategies, and operational restructuring to improve efficiency.
Looking ahead, we believe the growing sophistication of global Chinese investors and their increasing demand for diversified investment solutions align well with our evolving product suite. We continue to invest in talent development and technology infrastructure to ensure readiness to capture emerging opportunities. As domestic capital market conditions continue improving, we expect our strong brand recognition and operational discipline to position us for sustainable growth over the long term.
5
Details of the development of our domestic business structured around three core segments during the Reporting Period are as follows:
Domestic public securities
Domestic public securities, operating under the Noah Upright brand, is the business that distributes mutual funds and private secondary products. During the Reporting Period, this segment concentrated on developing an “online-first, offline-supported” business model, with the goal of facilitating global asset allocation through RMB-denominated products. Following policy incentives introduced in September 2024, the A-share and Hong Kong markets continued showing strong performance, driving a year-over-year increase of over 75% in transaction value contributed by the segment, primarily driven by a more than 180% increase in fundraising for our RMB-denominated private secondary products during the first half of 2025. Looking ahead, we believe sustained capital market activity and continued policy support will create new opportunities for client acquisition, enabling us to further expand our market share.
Domestic asset management
Domestic asset management, operating under the Gopher Asset Management brand, is the business that manages RMB-denominated private equity funds and private secondary products. The focus remains on managing primary market exits and cross-border ETF products in the secondary market. Due to the absence of new fundraising for RMB-denominated private equity funds in the first half of 2025, the gradual expiration of legacy products is expected to reduce the management fee base. In response, we are accelerating the expansion of our overseas investment product offerings and growing our secondary market. These efforts aim to offset – and ultimately exceed – the impact of the declining management fee base from maturing onshore products.
Domestic insurance
Domestic insurance, operating under the Glory brand, is the business that distributes insurance products, consisting mainly of life and health insurance products. In the first half of 2025, revenue from this segment was impacted by adjustments to our sales team structure and a strategic shift in product focus. While the transition to a new model will require time to be reflected in our financial results, we believe this restructuring positions the business for long-term, stable growth. Looking ahead, we will prioritize the recruitment of commission-only brokers to drive the delivery of comprehensive family succession planning services, further strengthening this segment’s future potential.
Overseas Business Expansion and Vision
At the end of 2024, we executed a clear strategic vision to expand our global presence, and in the first half of 2025, we achieved considerable progress. Overseas revenue accounted for 48% of total net revenue in the first half of 2025, representing a year-over-year increase. This was primarily driven by contributions from our exclusive alternative investment products, which rose 18.9% compared to the same period last year.
To meet the evolving needs of a growing global client base, we continue to offer a comprehensive suite of products denominated in both RMB and USD. Our competitive edge is anchored in an extensive network of esteemed product and investment partners worldwide, enabling us to continuously enhance our portfolio of high-quality, exclusive alternative investment solutions. Building on this strong foundation, the Group will strategically venture into frontier non-traditional asset ecosystems to capture new growth opportunities and further diversify our value proposition.
6
Through strategic expansion in key markets such as Singapore, Japan, and Hong Kong, we have transformed ARK into a truly global wealth management platform. We intend to ride on this momentum by pursuing quality opportunities in new markets, including the U.S. and Canada, while continuing to develop more innovative products in both RMB and USD, and deepening local expertise in the jurisdictions we operate.
Our overseas operations are structured into three core segments:
Overseas wealth management
Overseas wealth management, operating under the ARK Wealth Management brand, is the business that provides offline and online wealth management services.
As of June 30, 2025, our overseas registered clients exceeded 18,800, representing a 13.0% year-over-year increase. The number of active clients surpassed 3,600, representing a 12.5% year-over-year increase. Our overseas AUA, including distributed products, reached US$9.1 billion, reflecting a 6.6% increase compared to the same period last year. Looking ahead, we will continue to deepen our coverage in these key markets while expanding our client base through both existing relationships and new client acquisition. To cater to the diverse needs and preferences of our clientele, we will design and introduce tailored suites of investment products aligned with a range of thematic strategies.
Overseas asset management
Overseas asset management, operating under the Olive Asset Management brand, is the business that manages USD-denominated private equity funds and private secondary products. Over the past two and a half years, we have significantly enhanced the competitiveness of our overseas primary market product shelf through the establishment of a dedicated U.S. product center. This allows us to offer private equity products that are on par with those provided by leading global private banks. On the secondary market side, we have expanded partnerships with top-tier global managers and diversified our offerings in structured products and hedge funds.
In the first half of 2025, fundraising for hedge funds and structured products reached US$420 million, representing a 282.0% year-over-year increase. We raised US$340 million in USD-denominated private equity and private credit funds, representing a 0.8% year-over-year increase. As of June 30, 2025, our actively managed overseas AUM reached US$41.4 billion, representing an increase of 5.9% compared to the same period last year. Moving forward, we will continue to strengthen our global alternative investment capabilities to meet the evolving needs of our clients.
7
Overseas insurance and comprehensive services
Overseas insurance and comprehensive services, operating under the Glory Family Heritage brand, is the business that provides comprehensive overseas services such as insurance, trust services and other services.
In recent years, competition in the overseas insurance market – particularly in Hong Kong – has intensified, resulting in a decline in revenue from this segment in the first half of 2025. In response, we are actively exploring new business models and expanding our insurance offerings beyond Hong Kong to other international markets. We are also investing in the recruitment of licensed, commission-only brokers to enhance our client acquisition efforts. By the end of 2025, Glory Family Heritage aims to establish a team of 150 self-employed, commission-based brokers to catalyze the next phase of client growth for this segment.
Business Outlook
We believe the operational adjustments implemented throughout 2024 and early 2025 are beginning to yield meaningful results. The successful establishment of our global headquarters in Singapore and the rapid growth of our overseas business validate our strategic direction and position us well for the future. Looking ahead, we remain firmly focused on three key areas:
First, we will continue expanding our client base. Domestically, improving market conditions and industry consolidation create opportunities to serve clients seeking established, trusted wealth management partners. Overseas, we continue to see considerable untapped potential, particularly in jurisdictions with large populations of global Chinese HNW investors who remain underserved by local institutions where they live. We are actively exploring opportunities in new markets, including the U.S. and Canada. At the same time, we continue to invest in building a team of commission-only brokers to drive the turnaround of our insurance businesses.
Second, we will enhance our product offerings and investment capabilities to better serve our increasingly diverse client base. The road to achieving this is multifaceted, but is ultimately rooted in our “Global Network, Local Depth” approach – leveraging our presence across multiple jurisdictions to source best-in-class investment opportunities globally, while maintaining deep local market expertise. As our client base continues to expand, we will diversify our suite of offerings and enhance our global investment and asset-allocation frameworks to offer more competitive portfolios and strategic allocations. In the primary market, we will reinforce our distinctive ecosystem of product and investment partners – broadening our catalog, crafting bespoke investment approaches and securing exclusive opportunities. In the secondary market, we will leverage our global research and investment expertise to identify leading strategies from top-tier fund managers, strengthening our capacity to deliver robust, resilient asset-allocation solutions.
Third, we remain committed to maintaining operational excellence while pursuing growth remains paramount. Our cost reduction measures have played an instrumental role in navigating the current economic landscape, and we believe they provide a solid foundation for margin expansion as revenue rebounds.
Looking ahead, with our strengthened operational foundation, clear strategic focus, robust balance sheet, and healthy cash reserves, we remain confident in our ability to deliver sustainable growth and create lasting value for our clients and shareholders.
8
MANAGEMENT DISCUSSION AND ANALYSIS
Revenues
Historically, our revenues were derived from three business segments: wealth management, asset management and other services. Following a comprehensive evaluation of the nature of the Company’s evolving business operations and recent organizational adjustments, management has determined that a new segmentation approach adopted since the fourth quarter of 2024 has also been utilized to present management’s understanding of the financial performance and strategic progress of each business segment. As a result, besides representing our revenue under the traditional three business segments, the Company also discloses the Company’s revenues and operational costs and expenses for each of its six domestic and overseas business segments as well as headquarters in this analysis. This refined segmentation approach is designed to enhance resource allocation, provide investors with insights into the Company’s financial performance across its diverse business segments, and ensure alignment with the Company’s long-term strategic objectives. For the Reporting Period, the same disclosure approach will be implemented.
| For the Six Months Ended June 30, | ||||||||||||
| 2024 (Unaudited) | 2025 (Unaudited) | Change (%) | ||||||||||
| (RMB in thousands) | ||||||||||||
| Revenues: | ||||||||||||
| Wealth management business: | ||||||||||||
| One-time commissions | 324,061 | 312,759 | (3.5 | )% | ||||||||
| Recurring service fees | 481,518 | 465,676 | (3.3 | )% | ||||||||
| Performance-based income | 11,082 | 27,878 | 151.6 | % | ||||||||
| Other service fees | 65,093 | 56,368 | (13.4 | )% | ||||||||
| Total revenue for wealth management business | 881,754 | 862,681 | (2.2 | )% | ||||||||
| Asset management business: | ||||||||||||
| One-time commissions | 44 | 1,880 | 4172.7 | % | ||||||||
| Recurring service fees | 342,010 | 337,100 | (1.4 | )% | ||||||||
| Performance-based income | 31,218 | 23,830 | (23.7 | )% | ||||||||
| Total revenue for asset management business | 373,272 | 362,810 | (2.8 | )% | ||||||||
| Other businesses: | ||||||||||||
| Other service fees | 19,817 | 29,231 | 47.5 | % | ||||||||
| Total revenue for other business | 19,817 | 29,231 | 47.5 | % | ||||||||
| Total revenues | 1,274,843 | 1,254,722 | (1.6 | )% | ||||||||
Our total revenue decreased by 1.6% from RMB1,274.8 million for the six months ended June 30, 2024 to RMB1,254.7 million for the six months ended June 30, 2025. The decrease in total revenues was primarily due to a decrease in recurring service fees from private equity products in mainland China.
9
Wealth Management Business
For the wealth management business, our total revenue decreased by 2.2% from RMB881.8 million for the six months ended June 30, 2024 to RMB862.7 million for the six months ended June 30, 2025. Our transaction value remained stable at RMB33.1 billion for the six months ended June 30, 2025 as compared to RMB33.3 billion for the six months ended June 30, 2024.
| · | Total revenue from one-time commissions decreased by 3.5% from RMB324.1 million for the six months ended June 30, 2024 to RMB312.8 million for the six months ended June 30, 2025, primarily due to a decrease in distribution of insurance products. |
| · | Total revenue from recurring service fees decreased by 3.3% from RMB481.5 million for the six months ended June 30, 2024 to RMB465.7 million for the six months ended June 30, 2025, primarily due to a decrease in recurring service fees generated from domestic private equity products. |
| · | Total revenue from performance-based income increased by 151.6% from RMB11.1 million for the six months ended June 30, 2024 to RMB27.9 million for the six months ended June 30, 2025, primarily due to an increase in performance-based income from private secondary products. |
| · | Total revenue from other service fees decreased by 13.4% from RMB65.1 million for the six months ended June 30, 2024 to RMB56.4 million for the six months ended June 30, 2025, primarily due to a reduction in value-added services that we offered to our HNW clients. |
Asset Management Business
For the asset management business, our total revenue decreased by 2.8% from RMB373.3 million for the six months ended June 30, 2024 to RMB362.8 million for the six months ended June 30, 2025. Our AUM slightly decreased by 5.8%, from RMB154.0 billion as of June 30, 2024 to RMB145.1 billion as of June 30, 2025.
| · | Total revenue from one-time commissions increased significantly from RMB44,000 for the six months ended June 30, 2024 to RMB1.9 million for the six months ended June 30, 2025, mainly due to an increase in distribution of private secondary products domestically. |
| · | Total revenue from recurring service fees slightly decreased by 1.4% from RMB342.0 million for the six months ended June 30, 2024 to RMB337.1 million for the six months ended June 30, 2025, mainly due to a decrease in recurring service fees generated from domestic private equity products. |
| · | Total revenue from performance-based income decreased by 23.7% from RMB31.2 million for the six months ended June 30, 2024 to RMB23.8 million for the six months ended June 30, 2025, primarily due to a decrease in performance-based income from private equity products domestically. |
10
Other Businesses
For other businesses, our total revenue was RMB29.2 million for the six months ended June 30, 2025, representing a 47.5% increase from RMB19.8 million for the six months ended June 30, 2024, primarily due to an increase in other revenues relating to our suspended lending business.
The details in relation to our revenues generated under the refined segmentation approach are set forth as follows.
| For the Six Months Ended June 30, | ||||||||||||
| 2024 (Unaudited) | 2025 (Unaudited) | Change (%) | ||||||||||
| (RMB in thousands) | ||||||||||||
| Revenues: | ||||||||||||
| Domestic public securities(1) | ||||||||||||
| One-time commissions | 13,173 | 35,497 | 169.5 | % | ||||||||
| Recurring service fees | 218,171 | 195,801 | (10.3 | )% | ||||||||
| Performance-based income | 6,547 | 29,487 | 350.4 | % | ||||||||
| Total revenue for domestic public securities | 237,891 | 260,785 | 9.6 | % | ||||||||
| Domestic asset management(2) | ||||||||||||
| One-time commissions | 1,220 | 381 | (68.8 | )% | ||||||||
| Recurring service fees | 378,554 | 342,631 | (9.5 | )% | ||||||||
| Performance-based income | 13,822 | 1,353 | (90.2 | )% | ||||||||
| Total revenue for domestic asset management | 393,596 | 344,365 | (12.5 | )% | ||||||||
| Domestic insurance(3) | ||||||||||||
| One-time commissions | 30,616 | 13,673 | (55.3 | )% | ||||||||
| Total revenue for domestic insurance | 30,616 | 13,673 | (55.3 | )% | ||||||||
| Overseas wealth management(4) | ||||||||||||
| One-time commissions | 220,448 | 176,694 | (19.8 | )% | ||||||||
| Recurring service fees | 67,813 | 79,303 | 16.9 | % | ||||||||
| Other service fees | 40,806 | 35,403 | (13.2 | )% | ||||||||
| Total revenue for overseas wealth management | 329,067 | 291,400 | (11.4 | )% | ||||||||
| Overseas asset management(5) | ||||||||||||
| One-time commissions | 8,489 | 14,318 | 68.7 | % | ||||||||
| Recurring service fees | 158,253 | 185,041 | 16.9 | % | ||||||||
| Performance-based income | 21,931 | 20,868 | (4.8 | )% | ||||||||
| Total revenue for Overseas asset management | 188,673 | 220,227 | 16.7 | % | ||||||||
| Overseas insurance and comprehensive services(6) | ||||||||||||
| One-time commissions | 50,159 | 74,076 | 47.7 | % | ||||||||
| Other service fees | 17,490 | 15,172 | (13.3 | )% | ||||||||
| Total revenue for overseas insurance and comprehensive | 67,649 | 89,248 | 31.9 | % | ||||||||
11
| For the Six Months Ended June 30, | ||||||||||||
| 2024 (Unaudited) | 2025 (Unaudited) | Change (%) | ||||||||||
| (RMB in thousands) | ||||||||||||
| Headquarters(7) | ||||||||||||
| Recurring service fees | 737 | – | N.A. | |||||||||
| Other service fees | 26,614 | 35,024 | 31.6 | % | ||||||||
| Total revenue for headquarters | 27,351 | 35,024 | 28.1 | % | ||||||||
| Total revenues | 1,274,843 | 1,254,722 | (1.6 | )% | ||||||||
Notes:
| (1) | Operates under the Noah Upright brand. |
| (2) | Operates under the Gopher Asset Management brand. |
| (3) | Operates under the Glory brand. |
| (4) | Operates under the ARK Wealth Management brand. |
| (5) | Operates under the Olive Asset Management brand. |
| (6) | Operates under the Glory Family Heritage brand. |
| (7) | Headquarters reflects revenue generated from corporate operations at the Company’s headquarters in Shanghai as well as administrative costs and expenses that were not directly allocated to the aforementioned six business segments. |
Domestic public securities
Domestic public securities is the business that distributes mutual funds and private secondary products. Our total revenue increased by 9.6% from RMB237.9 million for the six months ended June 30, 2024 to RMB260.8 million for the six months ended June 30, 2025. The change was primarily due to an increase in one-time commissions generated from distribution of private secondary products and an increase in performance-based income from private secondary products.
Domestic asset management
Domestic asset management is the business that manages RMB-denominated private equity funds and private secondary products. Our total revenue decreased by 12.5% from RMB393.6 million for the six months ended June 30, 2024 to RMB344.4 million for the six months ended June 30, 2025. The change was primarily due to a decrease in private equity products AUM in mainland China.
Domestic insurance
Domestic insurance is the business that distributes insurance products, consisting mainly of life and health insurance products. Our total revenue decreased by 55.3% from RMB30.6 million for the six months ended June 30, 2024 to RMB13.7 million for the six months ended June 30, 2025. The change was primarily due to a decrease in distribution of domestic insurance products.
12
Overseas wealth management
Overseas wealth management is the business that provides offline and online wealth management services. Our total revenue decreased by 11.4% from RMB329.1 million for the six months ended June 30, 2024 to RMB291.4 million for the six months ended June 30, 2025. The change was primarily due to a decrease in allocated commission gained from distribution of overseas insurance products.
Overseas asset management
Overseas asset management is the business that manages USD-denominated private equity funds and private secondary products. Our total revenue increased by 16.7% from RMB188.7 million for the six months ended June 30, 2024 to RMB220.2 million for the six months ended June 30, 2025. The change was primarily due to an increase in one-time commissions and recurring service fees generated from distribution of overseas investment products managed by Olive Asset Management.
Overseas insurance and comprehensive services
Overseas insurance and comprehensive services is the business that provides comprehensive overseas services such as insurance, trust services and other services. Our total revenue increased by 31.9% from RMB67.6 million for the six months ended June 30, 2024 to RMB89.2 million for the six months ended June 30, 2025. The change was primarily due to an increase in allocated commission gained from distribution of overseas insurance products by commission-only brokers.
Headquarters
Headquarters reflects revenue generated from corporate operations at the Company’s headquarters in Shanghai as well as administrative costs and expenses that were not directly allocated to the aforementioned six business segments. Our total revenue increased by 28.1% from RMB27.4 million for the six months ended June 30, 2024 to RMB35.0 million for the six months ended June 30, 2025. The change was primarily due to more value-added services that we offered to our HNW clients.
Operating Costs and Expenses
Our financial condition and operating results are directly affected by our operating cost and expenses, primarily consisting of (i) compensation and benefits, including salaries and commissions for our relationship managers, share-based compensation expenses, performance-based bonuses, and other employee salaries and bonuses, (ii) selling expenses, (iii) general and administrative expenses, (iv) provision for credit losses, and (v) other operating expenses, which are partially offset by the receipt of government subsidies. Our operating costs and expenses are primarily affected by several factors, including the number of our employees, rental expenses and certain non-cash charges.
Our operating costs and expenses decreased by 11.2% from RMB1,009.9 million for the six months ended June 30, 2024 to RMB897.1 million for the six months ended June 30, 2025, which was primarily due to our cost control strategy on employee compensation and a decrease in one-off expense Gopher paid to one of its funds as general partner.
13
The details in relation to the operating costs and expenses under the traditional segmentation approach for the six months ended June 30, 2024 and 2025 are set forth as follows, facilitating investors’ comprehensive understanding of the Company’s operational and financial trends in terms of costs and expenses during the Reporting Period.
| For the Six Months Ended June 30, | ||||||||||||
| 2024 (Unaudited) |
2025 (Unaudited) |
Change (%) |
||||||||||
| (RMB in thousands) | ||||||||||||
| Wealth management | 747,550 | 654,642 | (12.4 | )% | ||||||||
| Asset management | 201,272 | 149,745 | (25.6 | )% | ||||||||
| Other businesses | 61,066 | 92,674 | 51.8 | % | ||||||||
| Total operating costs and expenses | 1,009,888 | 897,061 | (11.2 | )% | ||||||||
Wealth Management Business
For the wealth management business, our operating costs and expenses decreased by 12.4% from RMB747.6 million for the six months ended June 30, 2024 to RMB654.6 million for the six months ended June 30, 2025, primarily due to lower traveling expenses and our cost control strategy on employee compensation.
Asset Management Business
For the asset management business, our operating costs and expenses decreased by 25.6% from RMB201.3 million for the six months ended June 30, 2024 to RMB149.7 million for the six months ended June 30, 2025, primarily due to a decrease in one-off expenses Gopher paid to one of its funds as general partner.
Other Businesses
For other businesses, our operating costs and expenses for the six months ended June 30, 2025 were RMB92.7 million, representing a 51.8% increase from RMB61.1 million for the six months ended June 30, 2024, primarily due to an increase in provision for credit losses related to the suspended lending business.
14
In line with the presentation of revenues under the refined segmentation approach, our operating costs and expenses are also presented under this structure to offer a comprehensive view of the cost and expense profile of each business segment.
| For the Six Months Ended June 30, | ||||||||||||
| 2024 (Unaudited) | 2025 (Unaudited) | Change (%) | ||||||||||
| (RMB in thousands) | ||||||||||||
| Domestic public securities | 95,028 | 56,399 | (40.7 | )% | ||||||||
| Domestic asset management | 114,546 | 53,117 | (53.6 | )% | ||||||||
| Domestic insurance | 82,413 | 36,936 | (55.2 | )% | ||||||||
| Overseas wealth management | 287,249 | 205,562 | (28.4 | )% | ||||||||
| Overseas asset management | 45,784 | 57,482 | 25.6 | % | ||||||||
| Overseas insurance and comprehensive services | 38,523 | 56,724 | 47.2 | % | ||||||||
| Headquarters | 346,345 | 430,841 | 24.4 | % | ||||||||
| Total operating costs and expenses | 1,009,888 | 897,061 | (11.2 | )% | ||||||||
Domestic public securities
For the domestic public securities, our operating costs and expenses decreased by 40.7% from RMB95.0 million for the six months ended June 30, 2024 to RMB56.4 million for the six months ended June 30, 2025. The change was primarily due to a decrease in relationship manager compensation.
Domestic asset management
For the domestic asset management, our operating costs and expenses decreased by 53.6% from RMB114.5 million for the six months ended June 30, 2024 to RMB53.1 million for the six months ended June 30, 2025. The change was primarily due to a decrease in one-off expenses Gopher paid to one of its funds as general partner.
Domestic insurance
For the domestic insurance, our operating costs and expenses decreased by 55.2% from RMB82.4 million for the six months ended June 30, 2024 to RMB36.9 million for the six months ended June 30, 2025. The change was consistent with the decline in revenue from domestic insurance business.
Overseas wealth management
For the Overseas wealth management, our operating costs and expenses decreased by 28.4% from RMB287.2 million for the six months ended June 30, 2024 to RMB205.6 million for the six months ended June 30, 2025. The change was primarily due to a decrease in other compensation and a decrease in general marketing activities.
15
Overseas asset management
For the overseas asset management, our operating costs and expenses increased by 25.6% from RMB45.8 million for the six months ended June 30, 2024 to RMB57.5 million for the six months ended June 30, 2025. The change is consistent with the growth in revenues from overseas investment products managed by Olive Asset Management.
Overseas insurance and comprehensive services
For the overseas insurance and comprehensive services, our operating costs and expenses increased by 47.2% from RMB38.5 million for the six months ended June 30, 2024 to RMB56.7 million for the six months ended June 30, 2025. The change was primarily due to higher other operating expenses relating to overseas insurance business.
Headquarters
For the headquarters, our operating costs and expenses increased by 24.4% from RMB346.3 million for the six months ended June 30, 2024 to RMB430.8 million for the six months ended June 30, 2025. The change was primarily due to an increase in provision for credit losses related to the suspended lending business.
Compensation and Benefits
Compensation and benefits mainly include salaries and commissions for our relationship managers, salaries and bonuses for investment professionals and other employees, share-based compensation expenses for our employees and Directors, and bonuses related to performance-based income. Our total compensation and benefits decreased by 12.0% from RMB685.8 million for the six months ended June 30, 2024 to RMB603.2 million for the six months ended June 30, 2025, primarily due to our cost control strategy on employee compensation.
For the wealth management business, our compensation and benefits decreased by 10.9% from RMB540.3 million for the six months ended June 30, 2024 to RMB481.7 million for the six months ended June 30, 2025. During the Reporting Period, our relationship manager compensation decreased by 6.9% compared to the same period in 2024, aligning with the decreases in one-time commissions. Our other compensation decreased by 14.6% compared to the six months ended June 30, 2024, primarily due to our cost control strategy on employee compensation.
For the asset management business, our compensation and benefits decreased by 13.9% from RMB124.1 million for the six months ended June 30, 2024 to RMB106.9 million for the six months ended June 30, 2025, primarily due to our cost control strategy on employee compensation.
Selling Expenses
Our selling expenses primarily include (i) expenses associated with the operations of service centers, such as rental expenses, and (ii) expenses for online and offline marketing activities. Our selling expenses decreased by 8.7% from RMB124.2 million for the six months ended June 30, 2024 to RMB113.4 million for the six months ended June 30, 2025, primarily due to lower traveling expenses incurred.
16
For the wealth management business, our selling expenses decreased by 14.0% from RMB90.9 million for the six months ended June 30, 2024 to RMB78.2 million for the six months ended June 30, 2025, primarily due to lower traveling expenses incurred.
For the asset management business, our selling expenses during the six months ended June 30, 2025 were RMB24.4 million, which was effectively flat as compared to RMB24.2 million for the six months ended June 30, 2024.
General and Administrative Expenses
Our general and administrative expenses primarily include rental and related expenses of our leased office spaces and professional service fees. The main items include rental expenses for our Group and regional headquarters and offices, depreciation expenses, audit expenses and consulting expenses, among others. Our general and administrative expenses decreased by 10.2% from RMB151.0 million for the six months ended June 30, 2024 to RMB135.6 million for the six months ended June 30, 2025, primarily due to lower legal expenses incurred in the first half of 2025.
For the wealth management business, our general and administrative expenses decreased by 9.2% from RMB97.2 million for the six months ended June 30, 2024 to RMB88.3 million for the six months ended June 30, 2025, primarily due to lower legal expenses incurred in the first half of 2025.
For the asset management business, our general and administrative expenses decreased by 9.2% from RMB33.0 million for the six months ended June 30, 2024 to RMB29.9 million for the six months ended June 30, 2025.
Provision for or Reversal of Credit Losses
Provision for credit losses represents net changes of the allowance for loan losses as well as other financial assets. We recorded provision for credit losses amounting to RMB44.0 million during the Reporting Period, while recorded reversal credit losses of RMB0.4 million for the six months ended June 30, 2024, primarily due to an increase in provision for credit losses related to the suspended lending business.
For the wealth management business, our provision for credit losses for the six months ended June 30, 2025 was RMB6.3 million compared to the provision for credit losses of RMB4.7 million for the six months ended June 30, 2024, primarily due to an increase in the provision for losses related to accounts receivables.
For the asset management business, our reversal of credit losses for the six months ended June 30, 2025 was RMB0.1 million, while we recorded provision for credit losses of RMB0.9 million for the six months ended June 30, 2024. The change was primarily attributable to an increase in expected collection of our accounts receivables.
For other businesses, our provision for credit losses for the six months ended June 30, 2025 was RMB37.8 million, while reversal of credit losses was RMB6.0 million for the six months ended June 30, 2024. The change was mainly related to an increase in provision for credit losses related to the suspended lending business.
17
Other Operating Expenses
Our other operating expenses mainly include various expenses incurred directly in relation to our other service fees. Our other operating expenses decreased by 61.6% from RMB63.2 million for the six months ended June 30, 2024 to RMB24.3 million for the six months ended June 30, 2025, primarily due to a decrease in one-off expenses Gopher paid to one of its funds as general partner in the first half of 2025.
For the wealth management business, our other operating expenses decreased by 24.7% from RMB23.8 million for the six months ended June 30, 2024 to RMB17.9 million for the six months ended June 30, 2025, primarily driven by lower other operating expenses relating to trust business.
For the asset management business, our reversal of other operating expenses for the six months ended June 30, 2025 was RMB5.7 million, while other operating expenses for the six months ended June 30, 2024 were RMB23.5 million. The change was primarily due to a decrease in one-off expenses Gopher paid to one of its funds as general partner in the first half of 2025.
For other businesses, our other operating expenses decreased by 24.2% from RMB15.9 million for the six months ended June 30, 2024 to RMB12.0 million for the six months ended June 30, 2025, primarily due to lower other operating expenses relating to suspended lending business.
Government Subsidies
Our government subsidies are cash subsidies received in the PRC from local governments as incentives for investing and operating in certain local districts. Such subsidies are used by us for general corporate purposes and are reflected as an offset to our operating costs and expenses. Our government subsidies increased by 68.9% from RMB13.9 million for the six months ended June 30, 2024 to RMB23.4 million for the six months ended June 30, 2025, primarily due to an increase in government subsidies received from local governments.
For the wealth management business, our government subsidies increased by 90.2% from RMB9.3 million for the six months ended June 30, 2024 to RMB17.7 million for the six months ended June 30, 2025, primarily due to an increase in government subsidies received from local governments during the Reporting Period.
For the asset management business, our government subsidies increased by 27.6% from RMB4.4 million for the six months ended June 30, 2024 to RMB5.7 million for the six months ended June 30, 2025, primarily due to an increase in government subsidies received from local governments in the first half of 2025.
Income from Operations
As a result of the foregoing, our income from operations increased by 35.8% from RMB255.5 million for the six months ended June 30, 2024 to RMB347.0 million for the six months ended June 30, 2025. The increase in income from operations was primarily due to our cost control strategy on employee compensation which led to a 12.0% decrease in employee compensation as well as a decrease in one-off expenses Gopher paid to one of its funds as general partner.
18
Other Income
Our total other income decreased by 40.2% from RMB116.9 million for the six months ended June 30, 2024 to RMB69.9 million for the six months ended June 30, 2025. The decrease in other income was primarily attributable to unrealized loss from fair value changes on certain equity investments.
Income (Loss) from Equity in Affiliates
Our income from equity in affiliates was RMB35.7 million for the six months ended June 30, 2025, compared with loss from equity in affiliates of RMB53.9 million for the six months ended June 30, 2024. The increase in income from equity in affiliates was primarily due to an increase in fair value of the funds that Gopher managed and co-invested in.
Net Income
As a result of the foregoing, our net income increased by 39.4% from RMB235.6 million for the six months ended June 30, 2024 to RMB328.4 million for the six months ended June 30, 2025.
Liquidity and Capital Resources
We finance our operations primarily through cash generated from our operating activities. Our principal use of cash for the Reporting Period was for operating, investing and financing activities. As of June 30, 2025, we had RMB3,821.8 million in cash and cash equivalents, consisting of cash on hand, demand deposits, fixed term deposits and money market funds which are unrestricted as to withdrawal and use. As of June 30, 2025, our cash and cash equivalents of RMB8.6 million were held by the consolidated funds, which although not legally restricted, are not available to our general liquidity needs as the use of such funds is generally limited to the investment activities of the consolidated funds. We believe that our current cash and anticipated cash flow from operations will be sufficient to meet our anticipated cash needs, including our cash needs for at least the next 12 months. We may, however, need additional capital in the future to address unforeseen business conditions or other developments, including any potential investments or acquisitions we may pursue.
Significant Investments
The Company did not make or hold any significant investments during the six months ended June 30, 2025.
Material Acquisitions and Disposals
During the Reporting Period, the Company did not conduct any material acquisitions or disposals of subsidiaries and affiliated companies.
Pledge of Assets
As of June 30, 2025, we did not pledge any assets (as of December 31, 2024: nil).
19
Future Plans for Material Investments or Capital Assets
As of June 30, 2025, the Group did not have detailed future plans for material investments or capital assets.
Gearing Ratio
As of June 30, 2025, the Company’s gearing ratio (i.e., total liabilities divided by total assets, in percentage) was 17.7% (as of December 31, 2024: 15.0)%.
Accounts Receivable
Accounts receivable represents amounts invoiced or we have the right to invoice. As we are entitled to unconditional right to consideration in exchange for services transferred to customers, we therefore do not recognize any contract asset. As of June 30, 2025, 89.6% of the balance of our accounts receivable was within one year (as of December 31, 2024: 89.9)%.
Accounts Payable
As of June 30, 2025, the Group had no trade payables (as of December 31, 2024: nil).
Foreign Exchange Exposure
We earn the majority of our revenues and incur the majority of our expenses in Renminbi, and the majority of our sales contracts are denominated in Renminbi and majority of our costs and expenses are denominated in Renminbi, while a portion of our financial assets are denominated in U.S. dollars. Very limited hedging options are available in China to reduce our exposure to exchange rate fluctuations, and we have not used any forward contracts or currency borrowings to hedge our exposure to foreign currency risk. While we may decide to enter into hedging transactions in the future, the availability and effectiveness of these hedges may be limited and we may not be able to adequately hedge our exposure or at all. In addition, our currency exchange losses may be magnified by PRC exchange control regulations that restrict our ability to convert Renminbi into foreign currency. As a result, any significant revaluation of the Renminbi or the U.S. dollar may adversely affect our cash flows, earnings and financial position, and the value of, and any dividends payable on, our Shares and/or ADSs. For example, an appreciation of the Renminbi against the U.S. dollar would make any new RMB-denominated investments or expenditures more costly to us, to the extent that we need to convert U.S. dollars into Renminbi for such purposes. An appreciation of the Renminbi against the U.S. dollar would also result in foreign currency translation losses for financial reporting purposes when we translate our U.S. dollar-denominated financial assets into Renminbi, our reporting currency. Conversely, if we decide to convert Renminbi into U.S. dollars for the purpose of making payments for dividends on our Shares or ADSs, for payment of interest expenses, for strategic acquisitions or investments, or for other business purposes, appreciation of the U.S. dollar against the Renminbi would have a negative effect on us.
20
Contingent Liabilities
As of June 30, 2025, we had contingent liabilities of RMB467.3 million in relation to the unsettled Camsing Incident (as of December 31, 2024: RMB476.1 million). For further details, please refer to Note 8 to the condensed consolidated financial statements in this announcement.
Save as disclosed above and in “Material Litigation” in the section headed “Other Information” in this announcement, no material contingent liabilities, guarantees or any litigation against us, in the opinion of our Directors, are likely to have a material and adverse effect on our business, financial condition or results of operations as of June 30, 2025.
Capital Expenditures and Capital Commitment
Our capital expenditures primarily consist of purchases of property and equipment, and renovation and upgrade of our newly purchased office premises. Our capital expenditures were RMB48.2 million for the six months ended June 30, 2025 (for the six months ended June 30, 2024: RMB34.7 million). Such an increase was primarily driven by our renovation and upgrade of our headquarters in Hong Kong. As of June 30, 2025, we did not have any commitment for capital expenditures or other cash requirements outside of our ordinary course of business (as of December 31, 2024: nil).
Loans and Borrowings
The Group had no outstanding loans, overdrafts or borrowings from banks or any other financial institutions as of June 30, 2025 (as of December 31, 2024: nil).
Employees and Remuneration
As of June 30, 2025, the Company had a total of 1,908 employees. The following table sets out the breakdown of our full-time employees by function as of June 30, 2025:
| Function | Number
of Employees |
% of Total | ||||||
| PRC | ||||||||
| Domestic public securities | 294 | 15.4 | ||||||
| Domestic asset management | 207 | 10.8 | ||||||
| Domestic insurance | 51 | 2.7 | ||||||
| Overseas | ||||||||
| Overseas wealth management | 179 | 9.4 | ||||||
| Overseas asset management | 106 | 5.6 | ||||||
| Overseas insurance and comprehensive services | 115 | 6.0 | ||||||
| Headquarters | ||||||||
| Business development | 537 | 28.1 | ||||||
| Middle and back office support | 419 | 22.0 | ||||||
| Total | 1,908 | 100.0 | ||||||
21
We believe we offer our employees competitive compensation packages and a dynamic work environment that encourages initiative and is based on merit. As a result, we have generally been able to attract and retain qualified personnel and maintain a stable core management team.
The remuneration package of our employees includes salaries and commissions for our relationship managers, salaries and bonuses for investment professionals and other employees, share-based compensation expenses for our employees and Directors, and bonuses related to performance-based income.
As required by regulations in China, we participate in various employee social security plans that are organized by municipal and provincial governments, including endowment insurance, unemployment insurance, maternity insurance, employment injury insurance, medical insurance and housing provident fund. We enter into standard labor, confidentiality and non-compete agreements with our employees. The non-compete restricted period typically expires two years after the termination of employment, and we agree to compensate the employee with a certain percentage of his or her pre-departure salary during the restricted period.
We believe that we maintain a good working relationship with our employees, and we have not experienced any significant labor disputes during the Reporting Period.
We have been continuously investing in training and education programs for employees. We provide formal and comprehensive company-level and department-level training to our new employees, followed by on-the-job training. We also provide training and development programs to our employees from time to time to ensure their awareness and compliance with our various policies and procedures. Some of the training is conducted jointly by departments serving different functions but working with or supporting each other in our day-to-day operations.
The Company also has adopted the 2022 Share Incentive Plan. Further details in respect of the 2022 Share Incentive Plan are set out in the Company’s circular dated November 14, 2022.
OTHER INFORMATION
Compliance with the Corporate Governance Code
The Board is committed to achieving high corporate governance standards. The Board believes that high corporate governance standards are essential in providing a framework for the Company to safeguard the interests of Shareholders and to enhance corporate value and accountability.
During the Reporting Period, we have complied with all the code provisions of the Corporate Governance Code. The Board will review the corporate governance structure and practices from time to time and shall make necessary arrangements when the Board considers appropriate.
22
Compliance with the Model Code for Securities Transactions by Directors
The Company had implemented the Management Control Measures on Material Non-Public Information and the Policy on Prohibition of Insider Dealing (the “Code”) and on August 22, 2024, further adopted the Statement of Policies Governing Material Non-Public Information and the Prevention of Insider Trading (the “Statement”) as an amendment to the Code. The Statement, with terms no less exacting than the Model Code, serves as the Company’s own securities dealing code to regulate all dealings by Directors and relevant employees of securities in the Company and other matters covered by the Statement.
Specific enquiry has been made of all the Directors and the relevant employees, and they have confirmed that they have complied with the Model Code and the Statement during the Reporting Period.
Purchase, Sale or Redemption of the Company’s Listed Securities
On August 29, 2024, the Board authorized a share repurchase program (the “Share Repurchase Program”), under which the Company may repurchase up to US$50 million of its ADSs or Shares, effective on the same date. The authorized term for carrying out the Share Repurchase Program is two years. For further details of the Share Repurchase Program, please refer to the Company’s announcement dated August 29, 2024.
During the Reporting Period, the Company repurchased a total of 739,834 ADSs on the NYSE (representing 3,699,170 Shares) for an aggregate consideration of US$6,639,063.37 (before expense). As of June 30, 2025, 1,352,536 ADSs (representing 6,762,680 Shares) repurchased by the Company were held in treasury and nil was cancelled. Particulars of the repurchases made by the Company during the Reporting Period are as follows:
NYSE
| Month
in 2025 (U.S. Eastern Time) | No.
of ADS repurchased | No.
of Shares equivalent to the ADS | Highest
price paid (per ADS) | Lowest
price paid (per ADS) | Aggregate consideration paid (before expense) | |||||||||||
| (US$) | (US$) | (US$) | ||||||||||||||
| March 2025 | 7,122 | 35,610 | 9.50 | 9.47 | 67,644.04 | |||||||||||
| April 2025 | 620,407 | 3,102,035 | 9.49 | 7.80 | 5,509,111.04 | |||||||||||
| May 2025 | 112,305 | 561,525 | 9.49 | 9.31 | 1,062,308.29 | |||||||||||
| Total | 739,834 | 3,699,170 | 6,639,063.37 |
23
The Company intends to use treasury shares for the purposes in compliance with the Hong Kong Listing Rules.
Save as disclosed above, neither the Company nor any of its subsidiaries purchased, sold, or redeemed any of the Company’s securities listed on the Hong Kong Stock Exchange or any other stock exchanges (including sale of treasury shares (as defined in the Hong Kong Listing Rules)) during the Reporting Period.
Use of Proceeds from the Global Offering
The net proceeds received by the Company from the Global Offering (as defined in the Prospectus) were approximately HK$315.6 million. Save for disclosed herein, there has been no change in the intended use of net proceeds as previously disclosed in the Prospectus, and the Company has utilized certain net proceeds and expects to fully utilize the residual amount of the net proceeds in accordance with such intended purposes as disclosed in the Prospectus.
As of June 30, 2025, the Group had utilized the net proceeds as set out in the table below:
| Utilized | |||||||||||||||||||||||||||
| amount | Expected | ||||||||||||||||||||||||||
| Utilized | for the six | Utilized | Unutilized | time frame | |||||||||||||||||||||||
| % of use | amount as of | months ended | amount as of | amount as of | for unutilized | ||||||||||||||||||||||
| Purpose | of proceeds | Net proceeds | January 1, 2025 | June 30, 2024 | June 30, 2024 | June 30, 2024 | amount | ||||||||||||||||||||
| (HK$ million) | (HK$ million) | (HK$ million) | (HK$ million) | (HK$ million) | |||||||||||||||||||||||
| Fund the further development of our wealth management business | 35 | % | 110.5 | 110.5 | – | 110.5 | – | – | |||||||||||||||||||
| Fund the further development our asset management business | 15 | % | 47.3 | 47.3 | – | 47.3 | – | – | |||||||||||||||||||
| Fund the selective pursuit of potential investments | 20 | % | 63.1 | 10.4 | – | 10.4 | 52.7 | by the end of 2026(1) | |||||||||||||||||||
| Fund the investment in our in-house technology across all business lines | 10 | % | 31.6 | 31.6 | – | 31.6 | – | – | |||||||||||||||||||
| Fund our overseas expansion | 10 | % | 31.6 | 31.6 | – | 31.6 | – | – | |||||||||||||||||||
| General corporate purposes (including but not limited to working capital and operating expenses) | 10 | % | 31.6 | 31.6 | – | 31.6 | – | – | |||||||||||||||||||
| Total | 100 | % | 315.6 | 263.0 | – | 263.0 | 52.7 | by the end of 2026(1) | |||||||||||||||||||
Notes:
| (1) | As of the date of this announcement, there has been a delay in the expected timeline for certain uses of proceeds compared to the implementation plan as disclosed in our annual report for the year ended December 31, 2024. Such delay in use of proceeds is not material and mainly shown above as the delay in the expected time frame to fully use the portion of the net proceeds to fund the selective pursuit of potential investments as the Company considered it took longer time than expected to identify suitable investment targets. |
| (2) | The sum of the data may not add up to the total due to rounding. |
24
As of June 30, 2025, all the unutilized net proceeds are held by the Company in short-term deposits with licensed banks or authorized financial institutions.
Material Litigation
As of June 30, 2025, 109 investors’ legal proceedings against Shanghai Gopher and/or its affiliates in connection with the Camsing Incident with an aggregate claimed investment amount over RMB358.5 million were still pending. As of the date of this announcement, the management of the Group has assessed, based on the Group’s PRC legal adviser’s advice, the Group was unable to reasonably predict the timing or outcomes of, or estimate the amount of loss, or range of loss, if any, related to the pending legal proceedings.
In December 2022, the Group received a civil judgment from the Bozhou Intermediate People’s Court of Anhui Province (the “First Instance Court”). The judgment was related to a civil lawsuit brought by an external institution (the “Plaintiff”) against Noah (Shanghai) Financial Leasing Co., Ltd. (currently known as Shanghai Ziyan Car Leasing Service Co., Ltd.) (the “Defendant”), a subsidiary of the Company. The First Instance Court issued the judgment awarding the Plaintiff monetary damages of RMB99.0 million and corresponding interests (the “First-instance Judgment”). For further details, please refer to the Company’s announcement dated December 12, 2022.
In late March 2024, the Group received the civil judgment on appeal (the “Appellate Judgment”) from the High People’s Court of Anhui Province, affirming the First-instance Judgment. The Appellate Judgment took immediate effect, pursuant to which the Defendant shall make a payment to the Plaintiff within ten days from the date the Appellate Judgment became effective. Based on advice from the Company’s PRC counsel to this civil lawsuit, the Company believed that the claim of the Plaintiff is without merit and is unfounded, and therefore subsequently applied for a retrial (the “Retrial Petition”) to the Supreme People’s Court of the PRC (the “PRC Supreme Court”) with respect to the ruling in the Appellate Judgment.
In early January 2025, the Company received the civil judgment on the retrial (the “Retrial Judgement”) from the PRC Supreme Court, which partially upheld the Company’s Retrial Petition finding errors in the application of law in the original judgments, and accordingly revoked the First-instance Judgment and Appellate Judgment. Pursuant to the Retrial Judgement, the Company shall be held liable for 70% of the compensation of RMB99.0 million along with the corresponding interest losses. As the Group had previously reserved a contingent liability of RMB99.0 million in accordance with the First-instance Judgment prior to the issuance of the Appellate Judgment and the Retrial Judgement, the ruling in the Retrial Judgement is not expected to materially affect the Group’s overall financial position in comparison to its financial position prior to the issuance of the Retrial Judgement.
25
Save as disclosed above, we were not a party to, and we were not aware of any judicial, arbitration or administrative proceedings that were pending or threatened against our Group during the six months ended June 30, 2025, that, in the opinion of our Directors, were likely to have a material and adverse effect on our business, financial condition or results of operations. We may from time to time be involved in litigation and claims incidental to the conduct of our business.
Settlement under the Settlement Plans
Reference is made to the 2024 annual report of the Company in relation to the settlement plans (the “Settlement Plans”) regarding the Camsing Incident (as defined therein). The Settlement Plans include: (i) two RSU vesting plans (Plan A and Plan B) for the affected clients to choose from offered by the Company prior to the Listing Date (collectively, the “Previous Settlement Plan”), the offers under which was accepted by 595 out of 818 affected clients as of the Listing Date; and (ii) new settlement plan (the “New Settlement Plan”) offered by the Company in 2024 so as to continue settling with the remaining 223 out of 818 affected clients (the “Remaining Affected Clients”), the offer under which was accepted by seven out of the Remaining Affected Clients as of June 30, 2025. The Company shall issue relevant Shares upon vesting of RSUs to the affected clients subject to the settlement pursuant to the issuance mandate granted, renewed or refreshed by the Shareholders at the annual general meeting(s) from time to time. During the Reporting Period, nil out of the Remaining Affected Clients had accepted the offer pursuant to the New Settlement Plan.
During the Reporting Period1, (i) 17,833 RSUs involving 178,332 Shares (represented by 35,666 ADSs) have vested under the Previous Settlement Plan, and (ii) nil RSUs involving nil Shares (represented by nil ADSs) have vested under the New Settlement Plan.
As of June 30, 2025, 3,764,605 RSUs involving 37,646,050 Shares (represented by 7,529,210 ADSs) have been granted by the affected clients who accepted the offers under the Settlement Plans, among which 1,871,482 RSUs involving 18,714,816 Shares (represented by 3,742,963 ADSs) have vested and 1,893,123 RSUs involving 18,931,234 Shares (represented by 3,786,247 ADSs) were outstanding and yet to vest.
Since June 30, 2025 and as of the date of this announcement, (i) 3,997 RSUs involving 39,970 Shares (represented by 7,994 ADSs) have vested under the Previous Settlement Plan; (ii) 4,516 RSUs involving 45,162 Shares (represented by 9,032 ADSs) have vested under the New Settlement Plan; and (iii) one affected client accepted the offer under the New Settlement Plan with 5,772 RSUs involving 57,720 Shares (represented by 11,544 ADSs) granted to such client, among which, nil RSUs have vested.
Events after the Reporting Period
There were no significant events that might adversely affect the Group after June 30, 2025 and immediately before the date of this announcement.
| 1 | The calculation of the number of vested RSUs under each of the Settlement Plans is based on the U.S. Eastern Time. |
26
Interim Dividend
The Board does not recommend the distribution of an interim dividend for the six months ended June 30, 2025.
Review of the Interim Results
The Audit Committee has reviewed the unaudited interim results of the Group for the six months ended June 30, 2025. In addition, the independent auditor of the Company, Deloitte Touche Tohmatsu, has reviewed our unaudited condensed consolidated financial statements for the six months ended June 30, 2025 in accordance with Hong Kong Standard on Review Engagements 2410 “Review of Interim Financial Information Performed by the Independent Auditor of the Entity.”
PUBLICATION OF THE INTERIM RESULTS ANNOUNCEMENT AND INTERIM REPORT
This interim results announcement is published on the websites of the Hong Kong Stock Exchange (www.hkexnews.hk) and the Company (ir.noahgroup.com). The interim report for the six months ended June 30, 2025 containing all the information required by Appendix D2 of the Hong Kong Listing Rules will be dispatched to the Shareholders as per the Company’s corporate communications arrangement and made available for review on the same websites in due course.
27
CONDENSED CONSOLIDATED STATEMENTS OF OPERATIONS
(Amount in Thousands, Except Share and Per Share Data)
| Six Months Ended June 30, | |||||||||||||||
| Notes | 2024 RMB | 2025 RMB | 2025 US$ | ||||||||||||
| (Unaudited) | (Unaudited) | (Unaudited) | |||||||||||||
| Revenues: | |||||||||||||||
| Revenues from others | |||||||||||||||
| One-time commissions | 313,149 | 309,458 | 43,199 | ||||||||||||
| Recurring service fees | 306,634 | 313,643 | 43,783 | ||||||||||||
| Performance-based income | 10,043 | 27,878 | 3,892 | ||||||||||||
| Other service fees | 84,910 | 85,599 | 11,949 | ||||||||||||
| Total revenues from others | 714,736 | 736,578 | 102,823 | ||||||||||||
| Revenues from funds Gopher/Olive1 manages | |||||||||||||||
| One-time commissions | 10,956 | 5,181 | 723 | ||||||||||||
| Recurring service fees | 516,894 | 489,133 | 68,280 | ||||||||||||
| Performance-based income | 32,257 | 23,830 | 3,327 | ||||||||||||
| Total revenues from funds Gopher/Olive1 manages | 560,107 | 518,144 | 72,330 | ||||||||||||
| Total revenues | 3 | 1,274,843 | 1,254,722 | 175,153 | |||||||||||
| Less: VAT related surcharges and other taxes | (9,454 | ) | (10,627 | ) | (1,483 | ) | |||||||||
| Net revenues | 1,265,389 | 1,244,095 | 173,670 | ||||||||||||
| Operating cost and expenses: | |||||||||||||||
| Compensation and benefits | |||||||||||||||
| Relationship manager compensation | (275,800 | ) | (246,284 | ) | (34,380 | ) | |||||||||
| Other compensations | (409,995 | ) | (356,878 | ) | (49,818 | ) | |||||||||
| Total compensation and benefits | (685,795 | ) | (603,162 | ) | (84,198 | ) | |||||||||
| Selling expenses | (124,222 | ) | (113,383 | ) | (15,828 | ) | |||||||||
| General and administrative expenses | (151,018 | ) | (135,637 | ) | (18,934 | ) | |||||||||
| (Reversal of) provision for credit losses | 428 | (44,038 | ) | (6,147 | ) | ||||||||||
| Other operating expenses, net | (63,153 | ) | (24,275 | ) | (3,389 | ) | |||||||||
| Government subsidies | 13,872 | 23,434 | 3,271 | ||||||||||||
| Total operating cost and expenses | (1,009,888 | ) | (897,061 | ) | (125,225 | ) | |||||||||
| Income from operations | 255,501 | 347,034 | 48,445 | ||||||||||||
28
| Six Months Ended June 30, | |||||||||||||||
| Notes | 2024 RMB | 2025 RMB | 2025 US$ | ||||||||||||
| (Unaudited) | (Unaudited) | (Unaudited) | |||||||||||||
| Other income: | |||||||||||||||
| Interest income | 88,772 | 66,306 | 9,256 | ||||||||||||
| Investment income (loss) | 15,585 | (7,668 | ) | (1,070 | ) | ||||||||||
| Other income | 1,107 | 11,310 | 1,579 | ||||||||||||
| Reversal of settlement expense | 7 | 11,476 | – | – | |||||||||||
| Total other income | 116,940 | 69,948 | 9,765 | ||||||||||||
| Income before taxes and income from equity in affiliates | 372,441 | 416,982 | 58,210 | ||||||||||||
| Income tax expense | 4 | (82,943 | ) | (124,295 | ) | (17,351 | ) | ||||||||
| (Loss) income from equity in affiliates | (53,942 | ) | 35,669 | 4,979 | |||||||||||
| Net income | 235,556 | 328,356 | 45,838 | ||||||||||||
| Less: net income attributable to non-controlling interests | 4,278 | 816 | 114 | ||||||||||||
| Net income attributable to Noah Holdings Private Wealth And Asset Management Limited shareholders | 231,278 | 327,540 | 45,724 | ||||||||||||
| Net income per share: | 5 | ||||||||||||||
| Basic | 0.66 | 0.94 | 0.13 | ||||||||||||
| Diluted | 0.66 | 0.93 | 0.13 | ||||||||||||
| Weighted average number of shares used in computation: | |||||||||||||||
| Basic | 350,183,620 | 349,281,037 | 349,281,037 | ||||||||||||
| Diluted | 350,816,527 | 351,937,458 | 351,937,458 | ||||||||||||
| Note 1: | Gopher/Olive refers to the Group’s subsidiaries and consolidated variable interest entities (“VIEs”) under the brands Gopher Asset Management and Olive Asset Management, through which the Group manages investments with underlying assets to better meet the diversified asset allocation and alternative investment demands of high net worth individuals and/or corporate entities. |
The accompanying notes are an integral part of these condensed consolidated financial statements.
29
CONDENSED CONSOLIDATED STATEMENTS OF COMPREHENSIVE INCOME
(Amount in Thousands)
| Six Months Ended June 30, | ||||||||||||
| 2024 RMB | 2025 RMB | 2025 US$ | ||||||||||
| (Unaudited) | (Unaudited) | (Unaudited) | ||||||||||
| Net income | 235,556 | 328,356 | 45,838 | |||||||||
| Other comprehensive income, net of tax | ||||||||||||
| Foreign currency translation adjustments | 82,683 | (87,598 | ) | (12,228 | ) | |||||||
| Fair value fluctuation of available for sale Investment | – | 469 | 65 | |||||||||
| Total other comprehensive income (loss), net of tax | 82,683 | (87,129 | ) | (12,163 | ) | |||||||
| Comprehensive income | 318,239 | 241,227 | 33,675 | |||||||||
| Less: comprehensive income attributable to non-controlling interests | 3,018 | 509 | 71 | |||||||||
| Comprehensive income attributable to Noah Holdings Private Wealth And Asset Management Limited shareholders | 315,221 | 240,718 | 33,604 | |||||||||
The accompanying note is an integral part of these condensed consolidated financial statements.
30
CONDENSED CONSOLIDATED BALANCE SHEETS
(Amount in Thousands, Except Share and Per Share Data)
| As of | |||||||||||||||
| Notes | December 31, 2024 RMB | June 30, 2025 RMB | June 30, 2025 US$ | ||||||||||||
| (Audited) | (Unaudited) | (Unaudited) | |||||||||||||
| Assets | |||||||||||||||
| Current assets: | |||||||||||||||
| Cash and cash equivalents | 3,822,339 | 3,821,846 | 533,509 | ||||||||||||
| Restricted cash | 8,696 | 10,617 | 1,482 | ||||||||||||
| Short-term investments | 1,274,609 | 1,602,362 | 223,681 | ||||||||||||
| Accounts receivable, net | 6 | 473,490 | 403,226 | 56,288 | |||||||||||
| Amounts due from related parties, net | 499,524 | 591,977 | 82,637 | ||||||||||||
| Loans receivable, net | 169,108 | 122,658 | 17,122 | ||||||||||||
| Other current assets | 226,965 | 223,676 | 31,222 | ||||||||||||
| Total current assets | 6,474,731 | 6,776,362 | 945,941 | ||||||||||||
| Long-term investments | 971,099 | 712,155 | 99,413 | ||||||||||||
| Investment in affiliates | 1,373,156 | 1,363,061 | 190,276 | ||||||||||||
| Property and equipment, net | 2,382,247 | 2,346,487 | 327,557 | ||||||||||||
| Operating lease right-of-use assets, net | 121,115 | 109,688 | 15,312 | ||||||||||||
| Deferred tax assets | 319,206 | 317,124 | 44,269 | ||||||||||||
| Other non-current assets | 137,291 | 120,005 | 16,752 | ||||||||||||
| Total Assets | 11,778,845 | 11,744,882 | 1,639,520 | ||||||||||||
| Liabilities and Equity | |||||||||||||||
| Current liabilities: | |||||||||||||||
| Accrued payroll and welfare expenses | 412,730 | 324,621 | 45,315 | ||||||||||||
| Income tax payable | 63,892 | 55,491 | 7,746 | ||||||||||||
| Deferred revenues | 72,259 | 62,097 | 8,668 | ||||||||||||
| Dividend payable | 10 | – | 550,000 | 76,777 | |||||||||||
| Contingent liabilities | 8 | 476,107 | 467,255 | 65,226 | |||||||||||
| Other current liabilities | 404,288 | 302,049 | 42,164 | ||||||||||||
| Total current liabilities | 1,429,276 | 1,761,513 | 245,896 | ||||||||||||
| Deferred tax liabilities | 246,093 | 242,254 | 33,817 | ||||||||||||
| Operating lease liabilities, non-current | 75,725 | 69,597 | 9,715 | ||||||||||||
| Other non-current liabilities | 15,011 | 9,755 | 1,362 | ||||||||||||
| Total Liabilities | 1,766,105 | 2,083,119 | 290,790 | ||||||||||||
31
| As of | |||||||||||||||
| December 31, | June 30, | June 30, | |||||||||||||
| 2024 | 2025 | 2025 | |||||||||||||
| Notes | RMB | RMB | US$ | ||||||||||||
| (Audited) | (Unaudited) | (Unaudited) | |||||||||||||
| Contingencies | 8 | ||||||||||||||
| Shareholders’ equity: | |||||||||||||||
| Ordinary shares (US$0.00005 par value): 1,000,000,000 shares authorized, 335,153,359 shares issued and 330,393,534 shares outstanding as of December 31, 2024 and 1,000,000,000 shares authorized, 337,540,826 shares issued and 329,154,476 shares outstanding as of June 30, 2025 | 113 | 114 | 16 | ||||||||||||
| Treasury stock | (53,345 | ) | (101,539 | ) | (14,174 | ) | |||||||||
| Additional paid-in capital | 3,907,992 | 3,944,220 | 550,592 | ||||||||||||
| Retained earnings | 5,904,540 | 5,682,080 | 793,188 | ||||||||||||
| Accumulated other comprehensive income | 186,548 | 99,726 | 13,921 | ||||||||||||
| Total Noah Holdings Private Wealth And Asset Management Limited shareholders’ equity | 9,945,848 | 9,624,601 | 1,343,543 | ||||||||||||
| Non-controlling interests | 66,892 | 37,162 | 5,187 | ||||||||||||
| Total Shareholders’ Equity | 10,012,740 | 9,661,763 | 1,348,730 | ||||||||||||
| Total Liabilities and Equity | 11,778,845 | 11,744,882 | 1,639,520 | ||||||||||||
The accompanying notes are an integral part of these condensed consolidated financial statements.
32
NOTES TO THE CONDENSED CONSOLIDATED FINANCIAL STATEMENTS
| 1. | Organization and Principal Activities |
Noah Holdings Private Wealth and Asset Management Limited (the “Company”), its subsidiaries and consolidated variable interest entities (“VIEs”) (together, the “Group”), is a leading and pioneer wealth management service provider in the People’s Republic of China (“PRC”) offering comprehensive one-stop advisory services on global investment and asset allocation primarily for high net wealth (“HNW”) investors. The Group began offering services in 2005 through Shanghai Noah Investment Management Co., Ltd. (“Noah Investment”), a consolidated VIE, founded in the PRC in August 2005.
| 2. | Summary of Principal Accounting Policies |
(a) Basis of Preparation
The accompanying condensed consolidated financial statements of the Group have been prepared in accordance with accounting principles generally accepted in the United States of America (“U.S. GAAP”). In addition, these condensed consolidated financial statements include applicable disclosures required by the Rules Governing the Listing of Securities on The Stock Exchange of Hong Kong Limited (“Listing Rules”) and by the Hong Kong Companies Ordinance.
(b) Use of Estimates
The preparation of financial statements in conformity with U.S. GAAP requires management to make estimates and assumptions that affect the reported amounts of assets and liabilities and the disclosures of contingent assets and liabilities at the date of the financial statements and the reported amounts of revenue and expense during the reporting period. Actual results could differ materially from such estimates. Significant accounting estimates reflected in the Group’s condensed consolidated financial statements include assumptions used to determine valuation allowance for deferred tax assets, allowance for credit losses, fair value measurement of underlying investment portfolios of the funds that the Group invests, fair value of financial instruments, assumptions related to the consolidation of entities in which the Group holds variable interests, assumptions related to the valuation of share-based compensation, variable consideration for revenue recognition, impairment of long-term investments, impairment of long-lived assets and loss contingencies.
(c) Foreign Currency Translation
The Company’s reporting currency is Renminbi (“RMB”). The Company’s functional currency is the United States dollar (“U.S. dollar or US$”). The Company’s operations are principally conducted through the subsidiaries and VIEs located in the PRC where RMB is the functional currency. For those subsidiaries and VIEs which are not located in the PRC and have the functional currency other than RMB, the financial statements are translated from their respective functional currencies into RMB.
Assets and liabilities of the Group’s overseas entities denominated in currencies other than the RMB are translated into RMB at the rates of exchange ruling at the balance sheet date. Equity accounts are translated at historical exchange rates and revenues, expenses, gains and losses are translated using the average rate for the period. Translation adjustments are reported as foreign currency translation adjustment and are shown as a separate component of other comprehensive income in the condensed consolidated statements of comprehensive income.
Translations of amounts from RMB into US$ are included solely for the convenience of the readers and have been made at the rate of US$1 = RMB7.1636 on June 30, 2025, representing the certificated exchange rate published by the Federal Reserve Board. No representation is intended to imply that the RMB amounts could have been, or could be, converted, realized or settled into US$ at that rate, or at any other rate.
33
| 3. | Revenues |
The Group derives revenue primarily from one-time commissions, recurring service fees and performance-based income paid by clients or investment product providers. The disaggregation of revenues by service lines have been presented in the condensed consolidated statements of operations.
Revenues by timing of recognition is analyzed as follows:
| Six Months Ended June 30, | ||||||||
| (Amount in Thousands) | ||||||||
| 2024 | 2025 | |||||||
| RMB | RMB | |||||||
| (Unaudited) | (Unaudited) | |||||||
| Revenue recognized at a point in time | 435,683 | 424,512 | ||||||
| Revenue recognized over time | 839,160 | 830,210 | ||||||
| Total revenues | 1,274,843 | 1,254,722 | ||||||
For the Group’s revenues generated from different geographic locations, please see Note 9 segment information.
| 4. | Income Taxes |
Cayman Islands
Under the current laws of the Cayman Islands, the Company is not subject to tax on its income or capital gains. In addition, the Cayman Islands do not impose withholding tax on dividend payments.
Hong Kong
Under the current Hong Kong Inland Revenue Ordinance, the first HK$2 million of profits earned by the Company’s subsidiaries incorporated in Hong Kong will be taxed at half the current tax rate (i.e. 8.25%) while the remaining profits will continue to be taxed at the existing 16.5% tax rate. The profits of group entities incorporated in Hong Kong not qualifying for the two-tiered profits tax rates regime will continue to be taxed at a flat rate of 16.5%. In addition, payments of dividends from Hong Kong subsidiaries to their shareholders are not subject to any Hong Kong withholding tax.
PRC
Under the Law of the People’s Republic of China on Enterprise Income Tax (“EIT Law”), domestically-owned enterprises and foreign-invested enterprises (“FIEs”) are subject to a uniform tax rate of 25%. Zigong Noah Financial Service Co., Ltd. falls within the encouraged industries catalogue in Western China, which is eligible for preferential income tax rate of 15%. Shanghai Nuorong Information Technology Co., Ltd. obtained the approval for preferential income tax rate of 15% due to High and New Technology Enterprise in November 2022 and such preferential income tax rate will expire in November 2025.
34
| 4. | Income Taxes (continued) |
The tax expense comprises:
| Six Months Ended June 30, | ||||||||
| 2024 | 2025 | |||||||
| RMB | RMB | |||||||
| (Unaudited) | (Unaudited) | |||||||
| Current Tax | 69,177 | 125,857 | ||||||
| Deferred Tax | 13,766 | (1,562 | ) | |||||
| Total | 82,943 | 124,295 | ||||||
| Effective income tax rate | 22.27 | % | 29.81 | % | ||||
For interim income tax reporting, the Group estimates its annual effective tax rate and applies it to its year-to-date ordinary income.
| 5. | Net Income Per Share |
The following table sets forth the computation of basic and diluted net income per share attributable to ordinary shareholders:
| Six Months Ended June 30, | ||||||||
| 2024 | 2025 | |||||||
| (Unaudited) | (Unaudited) | |||||||
| Net income attributable to ordinary shareholders – basic and diluted | 231,278 | 327,540 | ||||||
| Weighted average number of ordinary shares outstanding – basic | 350,183,620 | 349,281,037 | ||||||
| Plus: effect of dilutive non-vested restricted shares awards | 632,907 | 2,656,421 | ||||||
| Weighted average number of ordinary shares outstanding – diluted | 350,816,527 | 351,937,458 | ||||||
| Basic net income per share | 0.66 | 0.94 | ||||||
| Diluted net income per share | 0.66 | 0.93 | ||||||
Shares issuable to the investors of Camsing Incident (as defined in Note 7) are included in the computation of basic earnings per share as the shares will be issued for no cash consideration and all necessary conditions have been satisfied upon the settlement.
Diluted net income per share does not include the following instruments as their inclusion would be antidilutive:
| Six Months Ended June 30, | ||||||||
| 2024 | 2025 | |||||||
| (Unaudited) | (Unaudited) | |||||||
| Share options | 168,577 | – | ||||||
| Non-vested restricted shares awards under share incentive plan | 285,299 | 339,609 | ||||||
| Total | 453,876 | 339,609 | ||||||
35
| 6. | Accounts Receivable, net |
Accounts receivable consisted of the following:
| As of | ||||||||
| December 31, | June 30, | |||||||
| 2024 | 2025 | |||||||
| RMB | RMB | |||||||
| (Audited) | (Unaudited) | |||||||
| Accounts receivable, gross | 490,689 | 421,091 | ||||||
| Allowance for credit losses | (17,199 | ) | (17,865 | ) | ||||
| Accounts receivable, net | 473,490 | 403,226 | ||||||
An aging analysis of accounts receivable, based on invoice date, is as follows:
| As of | ||||||||
| December 31, | June 30, | |||||||
| 2024 | 2025 | |||||||
| RMB | RMB | |||||||
| (Audited) | (Unaudited) | |||||||
| Within 1 year | 441,070 | 377,077 | ||||||
| 1-2 years | 23,166 | 14,513 | ||||||
| 2-3 years | 6,412 | 7,510 | ||||||
| 3-4 years | 5,774 | 6,259 | ||||||
| Over 4 years | 14,267 | 15,732 | ||||||
| Accounts receivable, gross | 490,689 | 421,091 | ||||||
| 7. | Settlement for Camsing Incident |
In July 2019, in connection with certain funds managed (“Camsing Credit Funds” or “Camsing Products”) by Shanghai Gopher Asset Management Co., Ltd. (“Shanghai Gopher”), a consolidated affiliated subsidiary of the Company, it is suspected that fraud had been committed by third parties related to the underlying investments (the “Camsing Incident”). A total of 818 investors were affected, and the outstanding amount of the investments that is potentially subject to repayment upon default amounted to RMB3.4 billion.
Settlement Plan
To preserve the Group’s goodwill with affected investors, it voluntarily made an exgratia settlement offer (the “Settlement Plan”) to affected investors. An affected client accepting the offer shall receive RSUs, which upon vesting will become ordinary shares of the Company, and in return forgo all outstanding legal rights associated with the investment in the Camsing Credit Funds and irrevocably release the Company and all its affiliated entities and individuals from any and all claims immediately, known or unknown, that relate to the Camsing Credit Funds.
On August 24, 2020, the Settlement Plan was approved by the Board of Directors of the Company that a total number of new Class A ordinary shares not exceeding 1.6% of the share capital of the Company has been authorized to be issued each year for a consecutive ten years for the Settlement Plan.
The Group evaluated and concluded the financial instruments to be issued under the Settlement Plan meet equity classification under ASC 815-40-25-10. Therefore, such instruments were initially measured at fair value and recognized as part of additional-paid-in-capital.
36
| 7. | Settlement for Camsing Incident (Continued) |
Settlement Plan (Continued)
As of December 31, 2020, the Group had no new settlement plan for the remaining unsettled investors, but would not preclude to reaching settlements in the future with similar terms and therefore estimated the probable amount of future settlement taking into consideration of possible forms of settlement and estimated acceptable level, and had recorded it as a contingent liability of US$81.3 million (RMB530.4 million).
During the year ended December 31, 2024, the Group remained open to settling with the affected clients, and voluntarily reoffered the Settlement Plan to the remaining unsettled investors with terms substantially unchanged. In 2024, additional 7 investors accepted the Settlement Plan, and the Company recorded reversal of settlement expenses in the amount of RMB12,454 (US$1,706) based on the difference between the fair value of the RSUs to be issued at each settlement date and the corresponding contingent liability accrued for these investors. For the six months ended June 30, 2025, no additional investors accepted the Settlement Plan.
As of June 30, 2025, 602 out of the total 818 investors (approximately 73.6%) had accepted settlements under the plan, representing RMB2.6 billion (approximately 76.4%) out of the total outstanding investments of RMB3.4 billion under the Camsing Products.
As of June 30, 2025, there were 109 investors whose legal proceedings against Shanghai Gopher and/or its affiliates, with an aggregate claimed investment amount over RMB358.5 million were still outstanding. As the date of this announcement, the management has assessed, based on its PRC legal counsels’ advices, the Group cannot reasonably predict the timing or outcomes of, or estimate the amount of loss, or range of loss, if any, related to the pending legal proceedings.
| 8. | Contingencies |
Camsing Incident
See Note 7 for details of contingencies for Camsing Incident.
Others
The Group is subject to periodic legal or administrative proceedings in the ordinary course of business. Other than those related to the Camsing Incident and the litigation mentioned above, the Group does not have any pending legal or administrative proceedings to which the Group is a party that will have a material effect on its business or financial condition.
| 9. | Segment Information |
The Group uses the management approach to determine operating segments. The management approach considers the internal organization and reporting used by the Group’s chief operating decision maker (“CODM”) for making decisions, allocating resources and assessing performance.
The Group operates in a set of segmentation, including six reportable segments and headquarters. The Group’s CODM has been identified as the chief executive officer, who reviews income (loss) from operations as segment profit/loss measurement to make decisions about allocating resources and assessing performance of the Group. Further, the Group’s CODM reviews and utilizes functional expenses or income, including compensation and benefits, selling expenses, general and administrative expenses, other operating expenses, provision for credit losses and government subsidies to manage the segments’ operations. The Group’s CODM does not review balance sheet information of the segments.
37
| 9. | Segment Information (Continued) |
Segment information of the Group’s business is as follow:
| Six Months Ended June 30, 2025 | ||||||||||||||||||||||||
| Overseas | ||||||||||||||||||||||||
| Domestic | Domestic | Overseas | Overseas | insurance and | ||||||||||||||||||||
| public | asset | Domestic | wealth | asset | comprehensive | |||||||||||||||||||
| securities | management | insurance | management | management | services | Headquarter1 | Total | |||||||||||||||||
| RMB | RMB | RMB | RMB | RMB | RMB | RMB | RMB | |||||||||||||||||
| Revenues: | ||||||||||||||||||||||||
| Revenues from others | ||||||||||||||||||||||||
| One-time commissions | 30,918 | 193 | 13,673 | 176,404 | 14,194 | 74,076 | – | 309,458 | ||||||||||||||||
| Recurring service fees | 171,246 | 78,819 | – | 19,074 | 44,504 | – | – | 313,643 | ||||||||||||||||
| Performance-based income | 27,689 | 45 | – | – | 144 | – | – | 27,878 | ||||||||||||||||
| Other service fees | – | – | – | 35,403 | – | 15,172 | 35,024 | 85,599 | ||||||||||||||||
| Total revenues from others | 229,853 | 79,057 | 13,673 | 230,881 | 58,842 | 89,248 | 35,024 | 736,578 | ||||||||||||||||
| Revenues from funds Gopher/Olive manages | ||||||||||||||||||||||||
| One-time commissions | 4,579 | 188 | – | 290 | 124 | – | – | 5,181 | ||||||||||||||||
| Recurring service fees | 24,555 | 263,812 | – | 60,229 | 140,537 | – | – | 489,133 | ||||||||||||||||
| Performance-based income | 1,798 | 1,308 | – | – | 20,724 | – | – | 23,830 | ||||||||||||||||
| Total revenues from funds Gopher/Olive manages | 30,932 | 265,308 | – | 60,519 | 161,385 | – | – | 518,144 | ||||||||||||||||
| Total revenues | 260,785 | 344,365 | 13,673 | 291,400 | 220,227 | 89,248 | 35,024 | 1,254,722 | ||||||||||||||||
| Less: VAT related surcharges | (1,533 | ) | (216 | ) | (72 | ) | – | – | – | (8,806 | ) | (10,627 | ) | |||||||||||
| Net revenues | 259,252 | 344,149 | 13,601 | 291,400 | 220,227 | 89,248 | 26,218 | 1,244,095 | ||||||||||||||||
| Operating costs and expenses: | ||||||||||||||||||||||||
| Compensation and benefits | ||||||||||||||||||||||||
| Relationship manager compensation | (48,215 | ) | (25,712 | ) | (12,606 | ) | (133,090 | ) | (15,066 | ) | (11,595 | ) | – | (246,284 | ) | |||||||||
| Other compensations | (13,721 | ) | (32,127 | ) | (15,320 | ) | (40,670 | ) | (27,432 | ) | (24,094 | ) | (203,514 | ) | (356,878 | ) | ||||||||
| Total compensation and benefits | (61,936 | ) | (57,839 | ) | (27,926 | ) | (173,760 | ) | (42,498 | ) | (35,689 | ) | (203,514 | ) | (603,162 | ) | ||||||||
| Selling expenses | (5,340 | ) | (3,851 | ) | (4,451 | ) | (28,745 | ) | (14,059 | ) | (5,319 | ) | (51,618 | ) | (113,383 | ) | ||||||||
| General and administrative expenses | (171 | ) | (2,827 | ) | (4,571 | ) | (3,057 | ) | (936 | ) | (2,151 | ) | (121,924 | ) | (135,637 | ) | ||||||||
| Reversal of (provision for) credit losses | 119 | 77 | – | – | – | 110 | (44,344 | ) | (44,038 | ) | ||||||||||||||
| Other operating (expenses) income, net | (1,042 | ) | 5,687 | – | – | – | (13,697 | ) | (15,223 | ) | (24,275 | ) | ||||||||||||
| Government subsidies | 11,971 | 5,636 | 12 | – | 11 | 22 | 5,782 | 23,434 | ||||||||||||||||
| Total operating costs and expenses | (56,399 | ) | (53,117 | ) | (36,936 | ) | (205,562 | ) | (57,482 | ) | (56,724 | ) | (430,841 | ) | (897,061 | ) | ||||||||
| Income (loss) from operations | 202,853 | 291,032 | (23,335 | ) | 85,838 | 162,745 | 32,524 | (404,623 | ) | 347,034 | ||||||||||||||
38
| 9. | Segment Information (Continued) |
Segment information of the Group’s business is as follow: (Continued)
| Six Months Ended June 30, 2025 | ||||||||||||||||||||||||
| Overseas | ||||||||||||||||||||||||
| Domestic | Domestic | Overseas | Overseas | insurance and | ||||||||||||||||||||
| public | asset | Domestic | wealth | asset | comprehensive | |||||||||||||||||||
| securities | management | insurance | management | management | services | Headquarter1 | Total | |||||||||||||||||
| RMB | RMB | RMB | RMB | RMB | RMB | RMB | RMB | |||||||||||||||||
| Revenues: | ||||||||||||||||||||||||
| Revenues from others | ||||||||||||||||||||||||
| One-time commissions | 6,375 | 1,220 | 30,616 | 217,537 | 7,242 | 50,159 | – | 313,149 | ||||||||||||||||
| Recurring service fees | 186,379 | 90,075 | – | 8,833 | 20,610 | – | 737 | 306,634 | ||||||||||||||||
| Performance-based income | 5,346 | – | – | – | 4,697 | – | – | 10,043 | ||||||||||||||||
| Other service fees | – | – | – | 40,806 | – | 17,490 | 26,614 | 84,910 | ||||||||||||||||
| Total revenues from others | 198,100 | 91,295 | 30,616 | 267,176 | 32,549 | 67,649 | 27,351 | 714,736 | ||||||||||||||||
| Revenues from funds Gopher/Olive manages | ||||||||||||||||||||||||
| One-time commissions | 6,798 | – | – | 2,911 | 1,247 | – | – | 10,956 | ||||||||||||||||
| Recurring service fees | 31,792 | 288,479 | – | 58,980 | 137,643 | – | – | 516,894 | ||||||||||||||||
| Performance-based income | 1,201 | 13,822 | – | – | 17,234 | – | – | 32,257 | ||||||||||||||||
| Total revenues from funds Gopher/Olive manages | 39,791 | 302,301 | – | 61,891 | 156,124 | – | – | 560,107 | ||||||||||||||||
| Total revenues | 237,891 | 393,596 | 30,616 | 329,067 | 188,673 | 67,649 | 27,351 | 1,274,843 | ||||||||||||||||
| Less: VAT related surcharges | (1,954 | ) | (622 | ) | (226 | ) | – | – | – | (6,652 | ) | (9,454 | ) | |||||||||||
| Net revenues | 235,937 | 392,974 | 30,390 | 329,067 | 188,673 | 67,649 | 20,699 | 1,265,389 | ||||||||||||||||
| Operating costs and expenses: | ||||||||||||||||||||||||
| Compensation and benefits | ||||||||||||||||||||||||
| Relationship manager compensation | (70,007 | ) | (31,302 | ) | (38,964 | ) | (130,233 | ) | (2,681 | ) | (2,613 | ) | – | (275,800 | ) | |||||||||
| Other compensations | (22,884 | ) | (46,682 | ) | (24,092 | ) | (93,694 | ) | (28,068 | ) | (22,934 | ) | (171,641 | ) | (409,995 | ) | ||||||||
| Total compensation and benefits | (92,891 | ) | (77,984 | ) | (63,056 | ) | (223,927 | ) | (30,749 | ) | (25,547 | ) | (171,641 | ) | (685,795 | ) | ||||||||
| Selling expenses | (5,471 | ) | (4,274 | ) | (2,487 | ) | (53,335 | ) | (13,037 | ) | (3,010 | ) | (42,608 | ) | (124,222 | ) | ||||||||
| General and administrative expenses | (658 | ) | (4,065 | ) | (16,862 | ) | (9,987 | ) | (1,998 | ) | (2,150 | ) | (115,298 | ) | (151,018 | ) | ||||||||
| (Provision for) reversal of credit losses | (88 | ) | (9,359 | ) | – | – | – | (3,352 | ) | 13,227 | 428 | |||||||||||||
| Other operating expenses, net | (679 | ) | (23,299 | )(17) | – | – | (4,464 | ) | (34,694 | ) | (63,153 | ) | ||||||||||||
| Government subsidies | 4,759 | 4,435 | 9 | – | – | – | 4,669 | 13,872 | ||||||||||||||||
| Total operating costs and expenses | (95,028 | ) | (114,546 | ) | (82,413 | ) | (287,249 | ) | (45,784 | ) | (38,523 | ) | (346,345 | ) | (1,009,888 | ) | ||||||||
| Income (loss) from operations | 140,909 | 278,428 | (52,023 | ) | 41,818 | 142,889 | 29,126 | (325,646 | ) | 255,501 | ||||||||||||||
| 1. | The financial information shown under “Headquarters” represents the revenues and operating cost and expenses generated by the Group’s headquarters which cannot be allocated to the six business segments. |
39
| 9. | Segment Information (Continued) |
The following table summarizes the Group’s revenues generated by the different geographic location.
| Six Months Ended June 30, | ||||||||
| 2024 | 2025 | |||||||
| RMB | RMB | |||||||
| (Unaudited) | (Unaudited) | |||||||
| Mainland China | 689,454 | 653,848 | ||||||
| Hong Kong | 443,110 | 458,756 | ||||||
| Overseas | 142,279 | 142,118 | ||||||
| Total revenues | 1,274,843 | 1,254,722 | ||||||
| 10. | Dividends |
The aggregate amount of the 2024 final dividend and non-recurring special dividend declared in the interim period amounted to approximately RMB550 million which were not paid as of June 30, 2025. By August 28, 2025, all the dividends have been paid. The Company did not make any interim dividend recommendation for the six months ended June 30, 2025.
40
DEFINITION AND ACRONYM
In this announcement, unless the context otherwise requires, the following expressions should have the following meanings:
| “2022 Share Incentive Plan” | the 2022 share incentive plan adopted at the annual general meeting held on December 16, 2022 with effect from December 23, 2022 and filed with the SEC on December 23, 2022 | |
| “ADS(s)” | American Depositary Shares (one ADS representing five Shares) | |
| “Articles” or “Articles of Association” | the memorandum of association and articles of association of the Company, as amended or supplemented from time to time | |
| “AUA” | assets under administration | |
| “Audit Committee” | the audit committee of the Company | |
| “AUM” | the amount of capital commitments made by investors to the funds we provide continuous management services without adjustment for any gain or loss from investment, for which we are entitled to receive recurring service fees or performance- based income, except for public securities investments. For public securities investments, “AUM” refers to the net asset value of the investments we manage, for which we are entitled to receive recurring service fees and performance-based income | |
| “Board” | the board of Directors | |
| “China” or “PRC” | the People’s Republic of China, excluding, for the purposes of this document only, Taiwan and the special administrative regions of Hong Kong and Macau, except where the context otherwise requires | |
| “Companies Ordinance” | the Companies Ordinance (Chapter 622 of the Laws of Hong Kong), as amended or supplemented from time to time | |
| “Company” | Noah Holdings Limited, an exempted company with limited liability incorporated in the Cayman Islands on June 29, 2007, carrying on business in Hong Kong as “Noah Holdings Private Wealth and Asset Management Limited (諾亞控股私人財富資產 管理有限公司)” | |
| “Consolidated Affiliated Entities” or “VIE(s)” | Shanghai Noah Investment Management Co., Ltd. (上海諾亞投 資管理有限公司), a limited liability company established under the laws of the PRC on August 26, 2005, and its subsidiaries, all of which are controlled by the Company through contractual arrangements via agreements underlying the variable interest entity structure |
41
| “Corporate Governance Code” | the Corporate Governance Code set out in Appendix C1 of the Hong Kong Listing Rules | |
| “Director(s)” | the director(s) of our Company | |
| “GAAP” | generally accepted accounting principles | |
| “Gopher” or “Gopher Asset Management” | Gopher Asset Management Co., Ltd. (歌斐資產管理有限公司), a limited liability company established under the laws of the PRC on February 9, 2012, and one of our Company’s Consolidated Affiliated Entities, or, where the context requires, with its subsidiaries collectively | |
| “Group”, “our Group”, “the Group”, “Noah”, “our”, “us” or “we” | the Company, its subsidiaries and the Consolidated Affiliated Entities from time to time | |
| “HK$” | Hong Kong dollars, the lawful currency of Hong Kong | |
| “HNW” | high net worth | |
| “HNW clients”, “HNW investors” | clients/investors with investable financial assets of no less than RMB6 million | |
| “Hong Kong” | the Hong Kong Special Administrative Region of the PRC | |
| “Hong Kong Listing Rules” | the Rules Governing the Listing of Securities on The Stock Exchange of Hong Kong Limited | |
| “Hong Kong Stock Exchange” or “HKEX” | The Stock Exchange of Hong Kong Limited | |
| “IFRS” | International Financial Reporting Standards, as issued by the International Accounting Standards Board | |
| “Model Code” | the Model Code for Securities Transactions by Directors of Listed Issuers set out in Appendix C3 of the Hong Kong Listing Rules | |
| “NYSE” | New York Stock Exchange | |
| “Prospectus” | the Company’s prospectus published on June 30, 2022 in connection with its secondary listing on the Hong Kong Stock Exchange | |
| “Reporting Period” | the six months ended June 30, 2025 | |
| “RMB” or “Renminbi” | Renminbi yuan, the lawful currency of China | |
| “RSU(s)” | restricted stock unit(s) |
42
| “SEC” | the United States Securities and Exchange Commission | |
| “SFO” | the Securities and Futures Ordinance (Chapter 571 of the Laws of Hong Kong), as amended or supplemented from time to time | |
| “Shanghai Gopher” | Shanghai Gopher Asset Management Co., Ltd. (上海歌斐資產管 理有限公司), a limited liability company established in the PRC on December 14, 2012, and one of the Consolidated Affiliated Entities and significant subsidiaries | |
| “Share(s)” | ordinary share(s) in the share capital of the Company, and upon the revised Articles of Association becoming effective, any share(s) in the capital of the Company | |
| “Shareholder(s)” | the holder(s) of the Share(s), and where the context requires, ADSs | |
| “subsidiary” or “subsidiaries” | has the meaning ascribed thereto in section 15 of the Companies Ordinance (Chapter 622 of the Laws of Hong Kong), as amended or supplemented from time to time | |
| “transaction value” | the aggregate value of the investment products we distribute during a given period | |
| “U.S.” or “United States” | the United States of America, its territories, its possessions and all areas subject to its jurisdiction | |
| “U.S. dollars” or “US$” | United States dollars, the lawful currency of the United States | |
| “U.S. GAAP” | accounting principles generally accepted in the United States | |
| “%” | per cent |
| By Order of the Board | ||
| Noah Holdings Private Wealth and Asset Management Limited | ||
| Jingbo Wang | ||
| Chairwoman of the Board |
Hong Kong, August 28, 2025
As of the date of this announcement, the Board comprises Ms. Jingbo Wang, the chairwoman, and Mr. Zhe Yin as Directors; Ms. Chia-Yue Chang, Mr. Boquan He and Mr. David Zhang as non-executive Directors; and Ms. Xiangrong Li, Ms. Cynthia Jinhong Meng and Ms. May Yihong Wu as independent Directors.
43